Figure 1f.

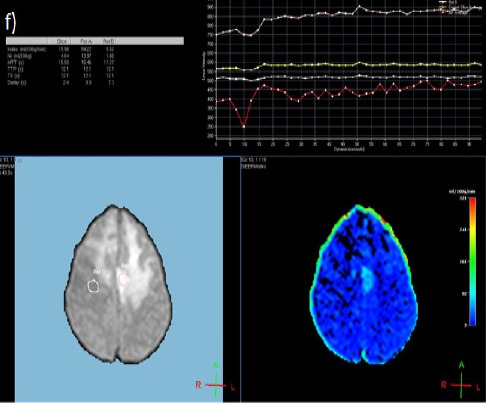
DSC MR Perfusion. The normalized rCBV was calculated and it showed value of 8.7. The color map showed evidence of vascularity

DSC MR Perfusion. The normalized rCBV was calculated and it showed value of 8.7. The color map showed evidence of vascularity