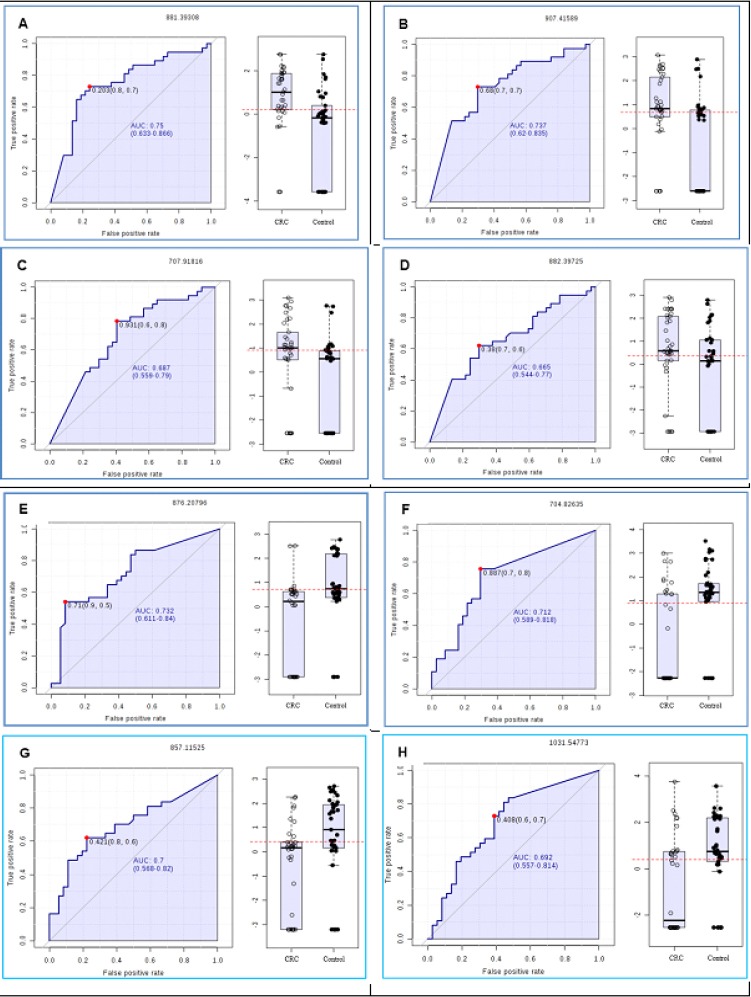
Figure 2.

A. The ROC Curve Analysis and Box-Plot Shows AUCs, Variable that Indicates the Accuracy of the Each Biomarker for CRC Group (A,B, C and D) and Classification in Controls (E,F,G and H). Note that the ROC curve analysis was performed only considering the biomarkers selected by PLS analysis
