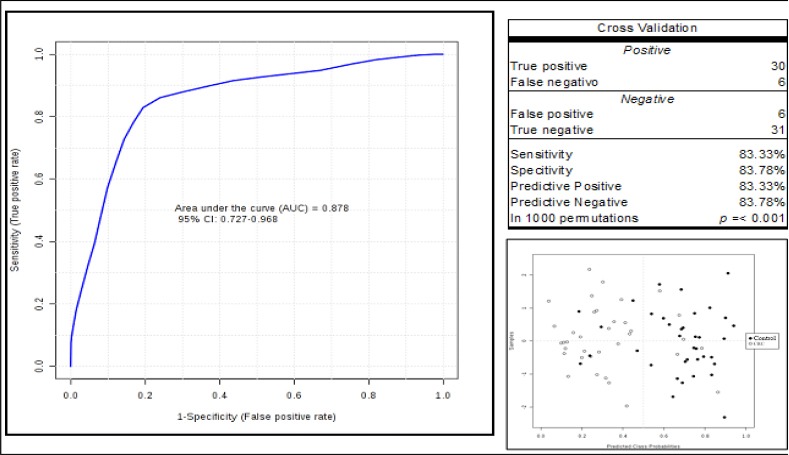
Figure 3.

Predictive Model ROC Curve - The blue line in the graph is the ROC curve for the predictive model. The AUC values, sensitivity and specificity of the predictive model obtained through the multiple logistic regression analysis were 87.80%, 83.33% and 83.78%, respectively, and the optimum cut-off value was 0.41.
