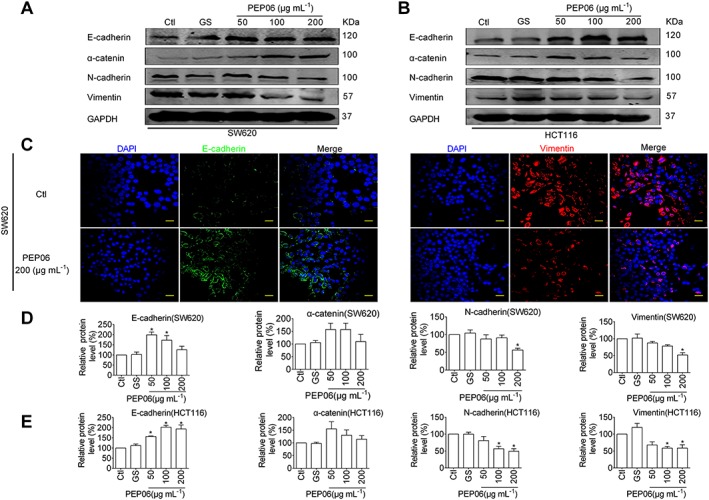
Figure 3.

Inhibitory effects of PEP06 on EMT in CRC cells. (A, B) Effects of PEP06 (50, 100 and 200 μg·mL−1) on the protein levels of EMT marker genes in SW620 and HCT116 cells observed by immunoblotting analysis. GAPDH was used as a sample loading control. (C) Effects of PEP06 (200 μg·mL−1) on the protein expression of EMT marker genes in SW620 and HCT116 cells observed by immunofluorescent staining. Blue: DAPI; green: E‐cadherin; and red: vimentin. Scale bar: 20 μm. (D, E) PEP06 increased E‐cadherin and α‐cantenin protein levels and decreased N‐cadherin and vimentin protein levels compared with the negative controls. Averaged data (mean ± SEM) of (A, B) from five independent experiments. * P < 0.05 by one‐way ANOVA, Dunnett's test: compared with Ctl. GS, glucose.
