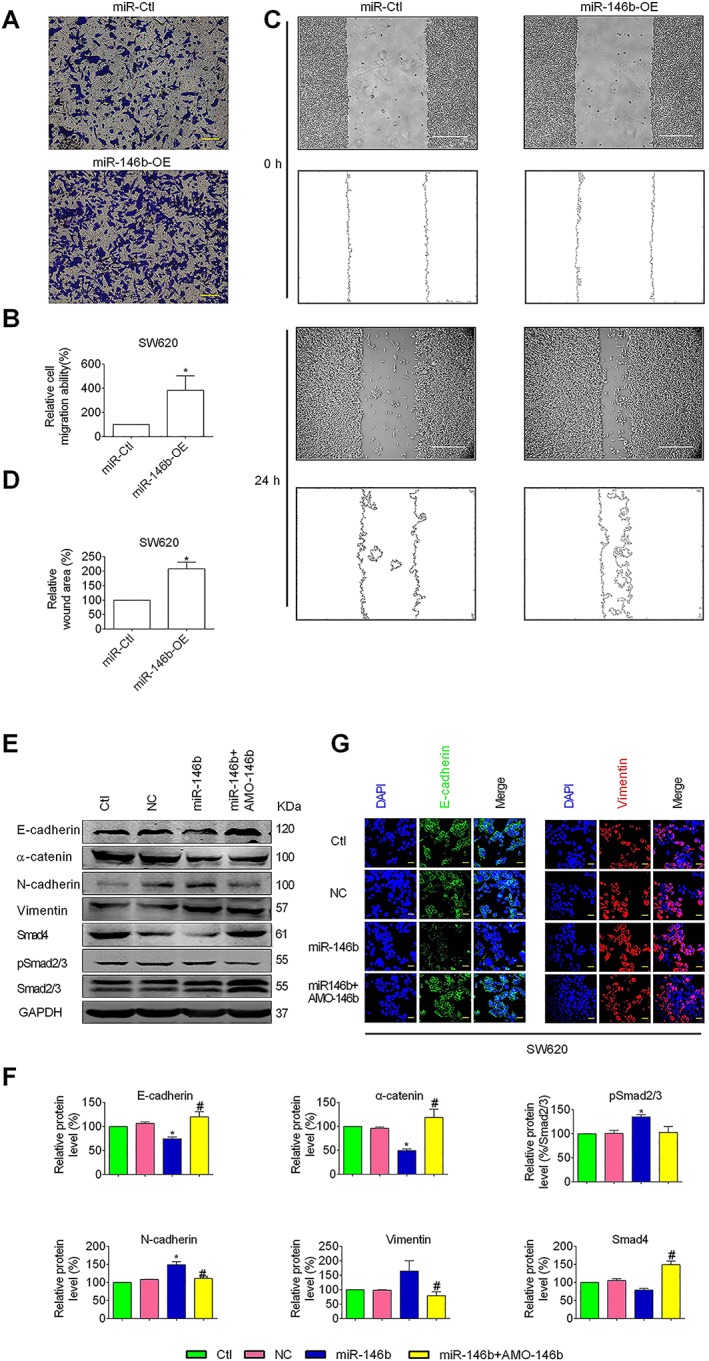
Figure 5.

Role of miR‐146b‐5p in mediating the effects of PEP06 on EMT in CRC cells. (A) MiR‐146‐5p and miR‐control expression vectors were each transfected into SW620 cells. The transwell migration assay showing the migration ability of SW620 cells with enforced expression of miR‐146b‐5p (miR‐146b‐OE) compared with the miR‐Ctl. (B) Averaged data (mean ± SEM, n = 5) from the transwell migration assay showing the acceleration of migration by miR‐146b‐5p. * P < 0.05 by unpaired t‐test, compared with miR‐Ctl. (C) The wound healing assay showed that the overexpression of miR‐146b (miR‐146b‐OE) enhanced the migratory capacity of SW620 cells compared with the negative controls (miR‐Ctl). (D) Averaged data (mean ± SEM, n = 5) from the wound‐healing assay showing the acceleration of migration by miR‐146b‐5p. * P < 0.05 by unpaired t‐test, compared with miR‐Ctl. (E) Effects of ectopic expression of miR‐146b‐5p on the protein levels of EMT markers, Smad4 and pSmad2/3 in SW620 cells. Cells were transfected with miR‐146b‐5p mimic, negative control mimic or miR‐146b‐5p mimic together with its antisense inhibitor AMO‐146b. (F) Western blot analysis showed that the level of E‐cadherin, α‐catenin and Smad4 was significantly decreased by the ectopic expression of miR‐146b‐5p, and the level of vimentin, N‐cadherin and pSmad2/3 (% Smad2/3) was increased. Whereas co‐transfection with miR‐146b mimic and AMO‐146b reversed this trend. The values of the protein band densities were normalized to those of the blank control group. Averaged values (mean ± SEM, n = 5) of Western blot band density normalized to the internal control GAPDH and to the data obtained from the Ctl groups. * P < 0.05 by one‐way ANOVA, Tukey's multiple comparison test: compared with Ctl. # P < 0.05, by one‐way ANOVA, Tukey's multiple comparison test: compared with miR‐146b. (G) Immunofluorescent staining of EMT marker proteins E‐cadherin (green) was decreased by miR‐146b mimic, and vimentin was increased (red) and DAPI was used to stain (blue) nuclei. Scale bar: 20 μm.
