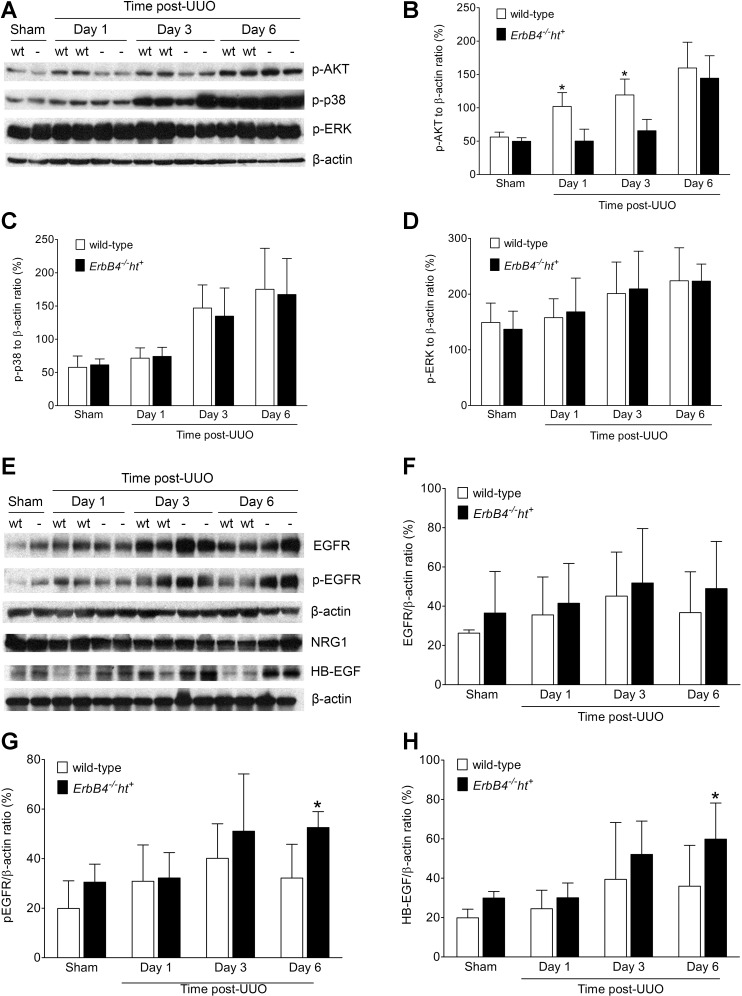
Fig. 10.
Signaling alterations after UUO injury. A: representative images from 3 independent experiments of MAP kinase protein expression levels by immunoblotting. B–D: densitometric analysis of immunoblotting in A expressed as ratios to β-actin. Values represent means ± SE. *P < 0.05 compared with the wild type. E: representative images of epidermal growth factor receptor (EGFR) expression, activation, and ligand level changes by Western blots. F–H: densitometric analysis of immunoblotting in E expressed as ratios to β-actin. Values represent means ± SE. *P < 0.05 compared with the wild type.

