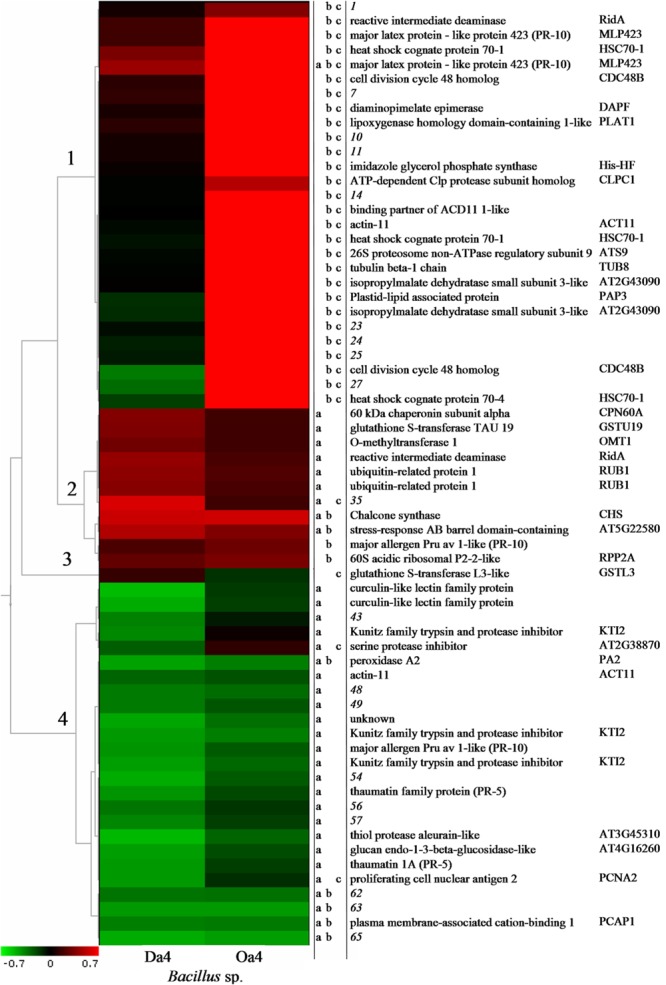
FIGURE 5.

Hierarchical cluster analysis results of the abundance data of proteoforms differentially expressed in apple cells co-incubated with Bacillus spp. strains Da_4 or Oa_4 for 6 h. Numbers on the left indicate four major clusters based on expression patterns. Colors indicate a decrease (green) or increase (red) in protein abundance compared to control. Letters in columns 1–3 indicate statistically significant (p < 0.01) differences between the Da_4 treatment and control (a), Oa_4 treatment and control (b), and between the Da_4 and Oa_4 treatments (c). Protein names and symbols are shown in columns 3 and 4, respectively.
