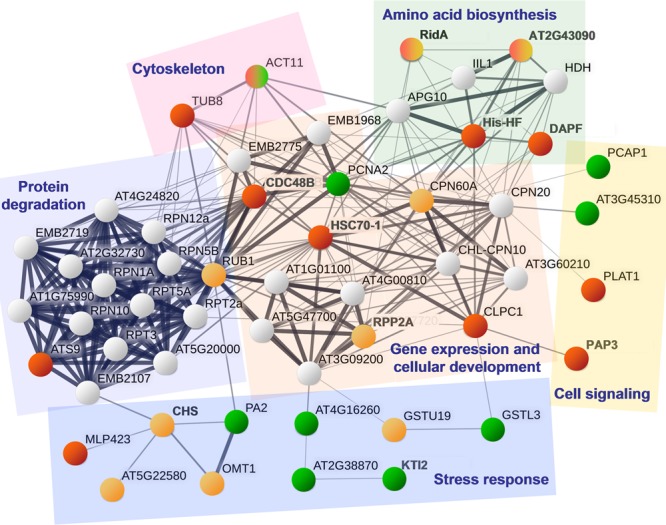
FIGURE 6.

A protein interaction network using A. thaliana proteins most closely related to the proteins (groups 1, 2, and 4) that were differentially expressed in apple cells co-incubated with Bacillus spp. strains Da_4 or Oa_4. The protein interaction network was built using the String database. Circle colors correspond to the protein group: 1 – red, 2 – orange, 4 – green, and gray circles represent additional network hubs that were not identified in this study. Proteins related by similar functions are outlined with colored shapes.
