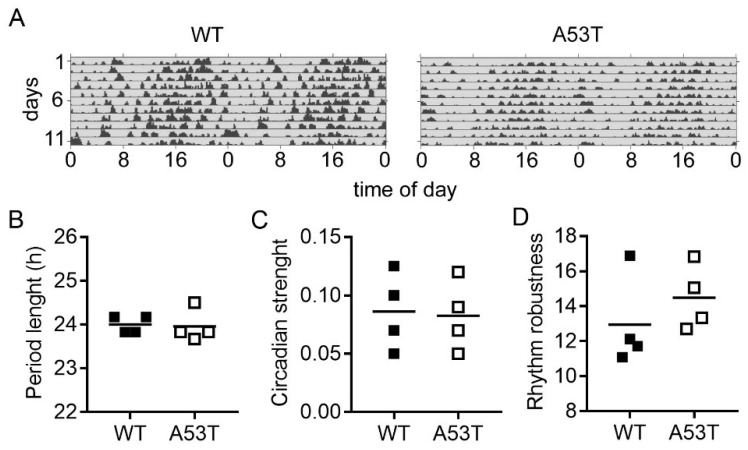
Figure 2.
Analysis of locomotor activity and rhythm robustness in constant darkness. (A) Representative double-plotted actograms of spontaneous locomotor activity of WT and A53T mice in constant darkness. Grey shading indicates darkness; (B) Major peak in the period length based on Chi-square periodograms; (C) Circadian strength based on Fast Fourier analysis; (D) Rhythm robustness based on Qp analysis. There were no significant differences (Mann–Whitney test) in any of these parameters between WT and A53T mice.

