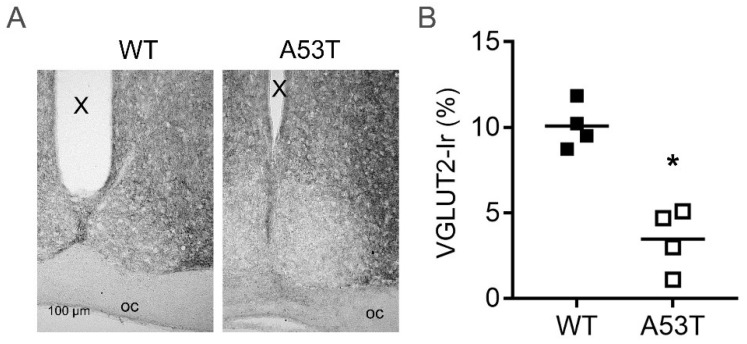
Figure 5.
VGLUT2 immunoreaction (Ir) in the SCN of WT and A53T mice. (A) Representative photomicrographs of VGLUT2 Ir in the SCN of WT and A53T-SNCA mice; oc, optic chiasm, X, third ventricle; (B) The graph shows a semiquantitative analysis of VGLUT2 Ir in the SCN of WT and A53T mice. The data are shown as the area of vGLUT2 Ir in % of the SCN area; n = 4 mice for each genotype; *: p < 0.05 (Mann–Whitney test).

