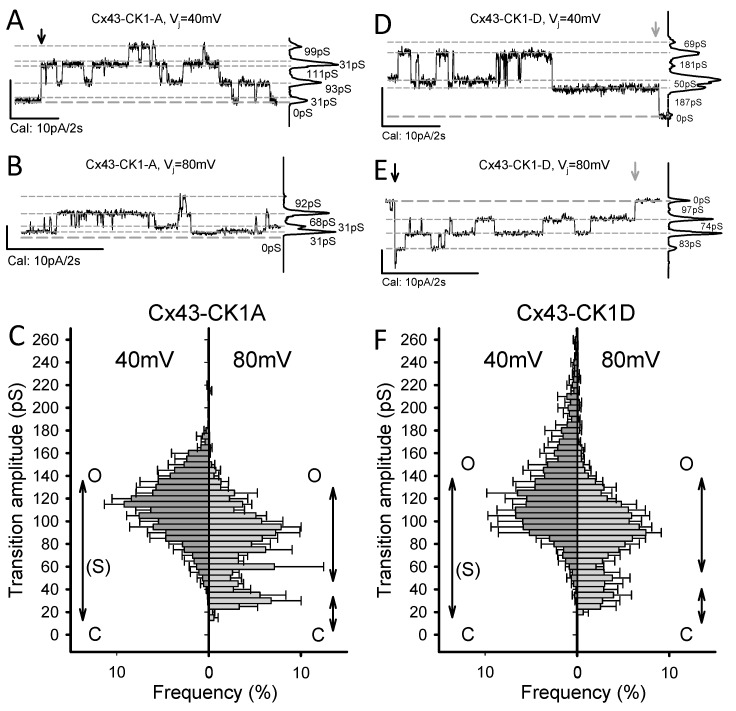
Figure 2.
Cx43-CK1-A and Cx43-CK1-D display fully open, Vj-sensitive gap junction channels. (A,B,D,E) Illustrative traces of channel activity from Cx43-CK1-A (A,B) and Cx43-CK1-D (D,E) expressing cell pairs, at 40 mV (A,D) and 80 mV (B,E) transjunctional gradients. For all traces: zero current (long-dashed line) and the most evident Ij levels (short-dashed lines) are indicated; when present, downward arrows mark the beginning (black) and end (gray) of pulses; plots at right are the all-points histogram for the displayed record segment, showing the fraction of time at each Ij level; numbers indicate the conductance change between current levels. Notice that channel transitions often occur between the identified levels. (C,F) Average transition amplitude histograms at 40 and 80 mV Vj values from Cx43-CK1-A (C) and Cx43-CK1-D (F). Peak fits indicated by solid black lines. Likely transitions between channel states (see main text for further explanation) are indicated by double arrowed vertical lines. Transition amplitude distributions of Cx43-CK1-D and Cx43-CK1-A differed from each other and from Cx43WT, at both Vj values of 40 and 80 mV. However, at Vj = 40 mV, both mutants displayed transitions amplitudes compatible with O↔C and O↔R transitions (if O = 150 pS and R = 30 pS). Transitions larger than 150 pS were documented for Cx43-CK1-D. At Vj = 80 mV, O-R and R-C transitions were more evident for both mutants. However, at both 40 and 80 mV, transitions between closed and levels smaller than fully open states were observed, suggesting substates (S). For each group, the number of experiments (n) and measured transitions (N) were respectively, as follows: For CK1-A, 6 and 1867 at 40 mV, 5 and 1080 at 80 mV. For CK1-D, 4 and 1369 at 40 mV, 6 and 1032 at 80 mV.

