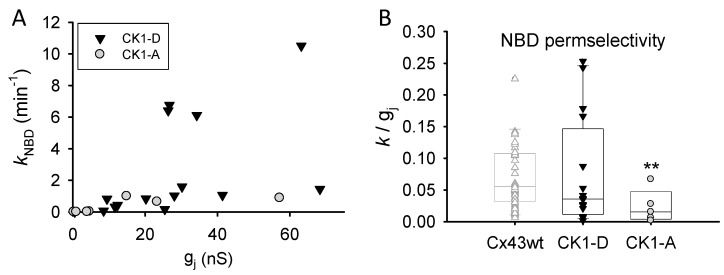
Figure 3.
Permselectivity of dephospho-mimicking Cx43-CK1-A GJs is lower and less variable than that of phospho-mimicking Cx43-CK1-D GJs. (A) Rate constant of transjunctional dye diffusion vs. junctional conductance for the indicated mutants. Each symbol represents a single experiment; (B) Distribution (box plots) of collected permselectivity values for Cx43-CK1-D (0.074 ± 0.022; n = 16) and Cx43-CK1-A (0.017 ± 0.001; n = 7); Cx43WT data (from [14]) shown in light gray for comparison. Note that permselectivity values of Cx43-CK1-D (and Cx43WT) do not display a normal distribution. ** Median and variance of Cx43-CK1-A are different from Cx43-CK1-D and Cx43-WT (p < 0.05). See text for further explanation.

