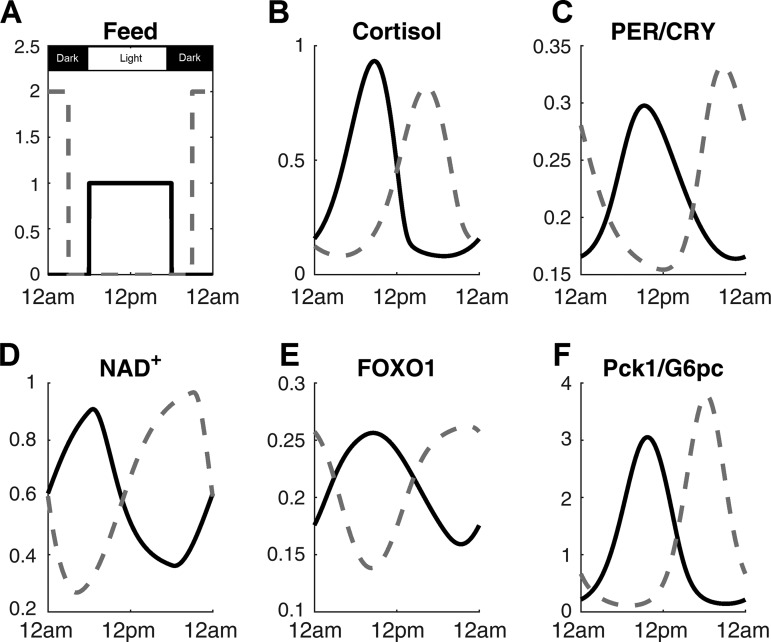
Fig. 2.
The time profiles of key components throughout the day on synchronized (solid line) and time-restricted (dotted line) feeding schedules. Light signal was at 1 from 6 AM to 6 PM and at 0 for the rest of the day. Feeding signals for both conditions are shown in A. The corresponding cortisol (B), PER/CRY protein (C), NAD+ (D), FOXO1 (E), and Pck1/G6pc mRNA (F) are also shown.

