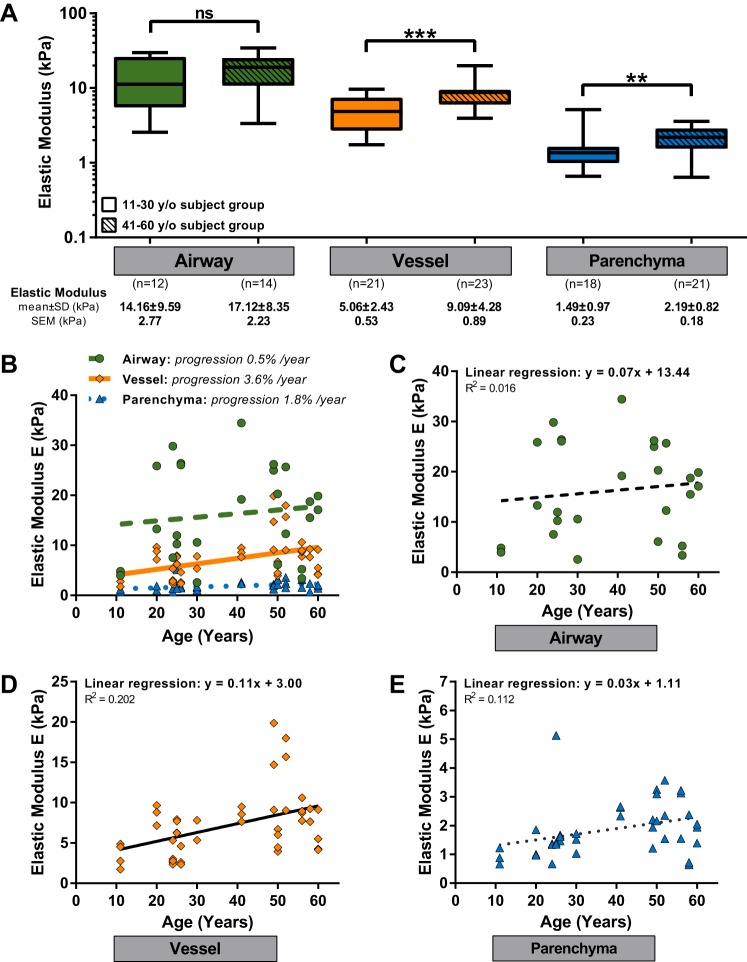
Fig. 2.
A: elastic modulus of lung tissue (airway, vessel, and parenchymal tissue) for 2 aging groups: 11–30 y/o subject group and 41–60 y/o subject group. Elastic results were compared using the Mann-Whitney test with **P < 0.01 and ***P < 0.001. B: graph combines all the results presented in C–E. C–E: elastic modulus for airways (C), pulmonary arteries (D), and parenchymal region (E) as a function of lung donor age. Each point is the mean elastic value of all the measurements performed on one area. Each line represents the fitting of the data by a linear regression model. R2 is the coefficient of determination.

