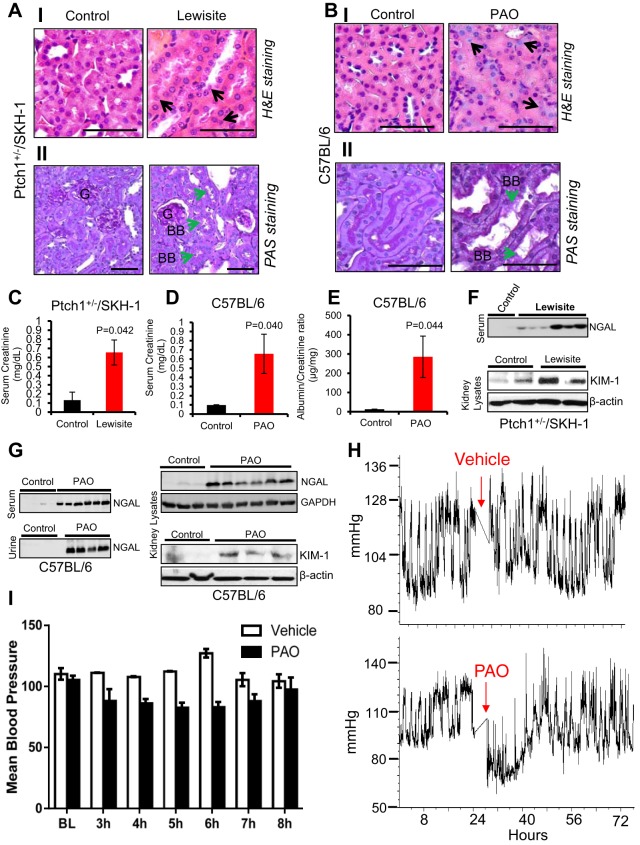
Fig. 1.
Effects of topical lewisite and phenylarsine oxide (PAO) exposure on acute kidney injury (AKI). Ptch1+/−/SKH-1 mice were exposed to lewisite, whereas C57BL/6 mice were exposed to PAO as described in materials and methods. Hematoxylin and eosin (H&E) staining showing representative photomicrographs of kidney tissue sections (5 µm) from control vs. lewisite/PAO-treated animals for 24 h. A–I: kidney sections of vehicle control and lewisite-treated Ptch1+/−/SKH-1 mice. B–I: kidney sections of vehicle and PAO-treated C57BL/6 mice. Vehicle-treated control mice show normal histological structure of tubules with little interstitial space, whereas lewisite- and PAO-treated animals show tubular injury with degenerative nuclei (black arrows). Bars = 25 µm. AII and BII: representative images of periodic acid–Schiff (PAS) staining showing the altered structural architecture and loss of brush border (green arrows) in proximal tubules of lewisite (AII)- and PAO (BII)-treated mice kidneys. Bars = 25 µm. BB, brush-border membrane; G, glomeruli. Photomicrographs were captured using an Olympus BX51 microscope with an Olympus DP71 digital camera. C and D: effects of cutaneous exposure of lewisite in Ptch1+/−/SKH-1 (C) or PAO in C57BL/6 (D) mice on serum creatinine (mg/dl) relative to their vehicle-treated control animals. E: albumin-to-creatinine ratio for control vs. PAO-exposed mice. P value represents significance level (n = 5/group). F: representative Western blot analysis of neutrophil gelatinase-associated lipocalin (NGAL) in serum and kidney injury molecule-1 (KIM-1) in kidney lysates of vehicle controls and lewisite-exposed Ptch1+/−/SKH-1 mice. G: Western blot analysis of NGAL in serum, urine, and kidney lysates and KIM-1 in kidney lysates of vehicle control and PAO-exposed C57BL/6 mice. H: blood pressure was recorded using a radiotelemetry system. Baseline measurements were taken over the 24 h before exposure. C57BL/6 mice were then exposed to either vehicle or PAO and returned for monitoring 3 h postexposure. Blood pressure was continuously monitored for 48 h. I: mean arterial pressure following PAO exposure. BL, baseline. Each lane represents band intensity from individual animal samples except for F (bottom), which represents pooled kidney lysates for each group (n = 5, control vs. lewisite).

