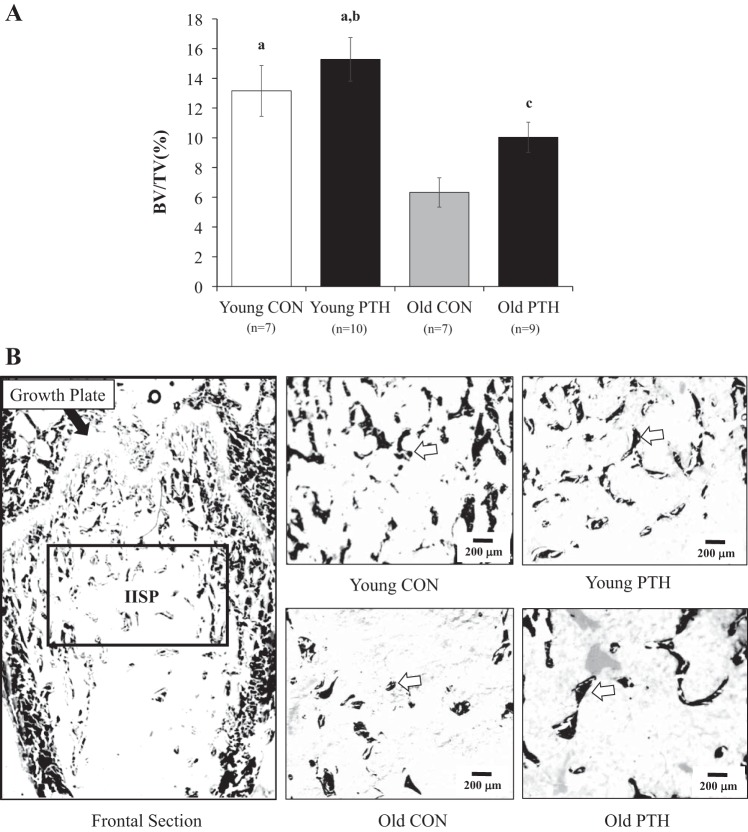
Fig. 1.
A: bone volume-to-total volume ratio (BV/TV) in the distal femoral metaphysis following 2 wk of intermittent parathyroid hormone (PTH) 1–34 administration in young and old rats. Data were analyzed by one-way ANOVA. Values are means ± SE. The sample size n represents the number of rats per group. aP < 0.050 vs. Old Control (CON), bP < 0.050 vs. Old PTH, cP = 0.073 vs. Old CON. B: two-dimensional frontal section of the distal femoral metaphysis. The black box illustrates the area of analysis [i.e., the secondary spongiosa (IISP)]. Representative images for each group are shown. The white arrows denote examples of trabecular bone.

