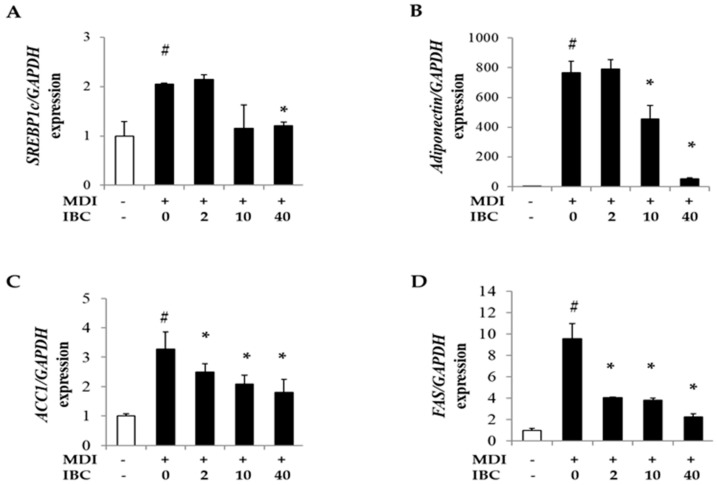
Figure 4.
Effect of IBC on levels of lipid metabolism related genes. 3T3-L1 adipocytes were differentiated with IBC at indicated concentrations. On D5, cells were harvested and cell lysates were used for RNA extraction followed by cDNA synthesis and qPCR to analyze gene expression levels of SREBP1c (A); adiponectin (B); ACC1 (C); and FAS (D). Data are presented as means ± SD of triplicate experiments. # p < 0.01 vs. control; * p < 0.01 vs. MDI only.

