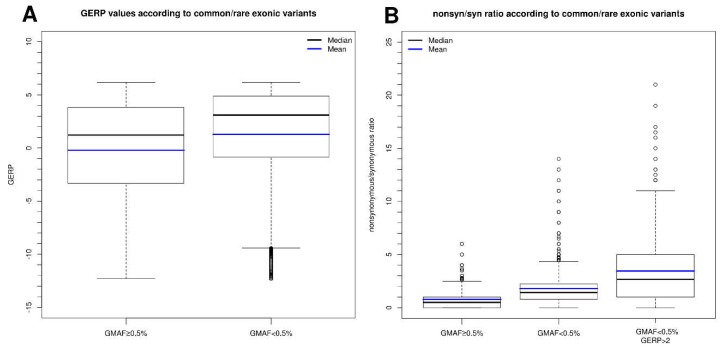
Figure 4.
(A) Boxplot of GERP (Genomic Evolutionary Rate Profiling) values according to common (GMAF > 0.5%) and rare (GMAF < 0.5%) exonic variants. (B) Boxplot of non-synonymous/synonymous ratio values of each gene according to: common (GMAF > 0.5%), rare (GMAF < 0.5%), and highly conserved rare variants (GMAF < 0.5%, GERP > 2).

