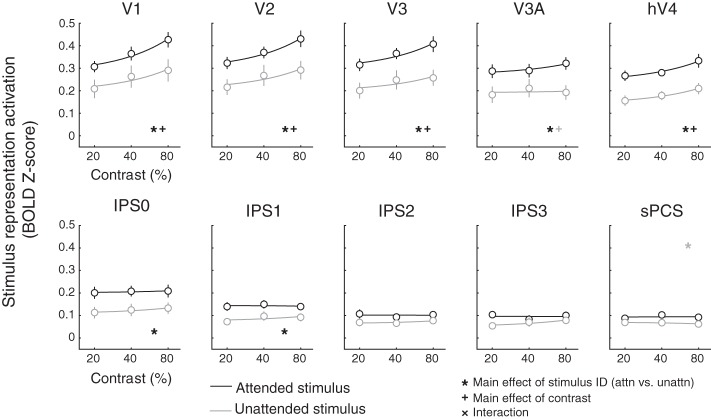
Fig. 5.
Quantifying sensitivity to visual salience and behavioral relevance across cortex. For each stimulus, we averaged the reconstruction activation on all trials where each stimulus appeared at a given contrast (see also Fig. 6). In visual cortex areas V1, V2, V3, and hV4, reconstructed map activation increased with stimulus salience, regardless of whether the stimulus was attended. In all regions of interest (ROIs) except for intraparietal sulcus regions IPS2 and IPS3 and superior precentral sulcus (sPCS), reconstructed map activation also reflected behavioral relevance such that the attended location was more active than the unattended location. Error bars are SE across participants (n = 8). Lines indicate best-fit linear contrast response function, and all data are plotted on a log scale. All P values are available in Table 1. Black symbols indicate significant main effects or interaction (corrected via false discovery rate across all ROIs), and gray symbols indicate trend (P ≤ 0.05, uncorrected). BOLD, blood oxygen level dependent; attn, attended; unattn, unattended.

