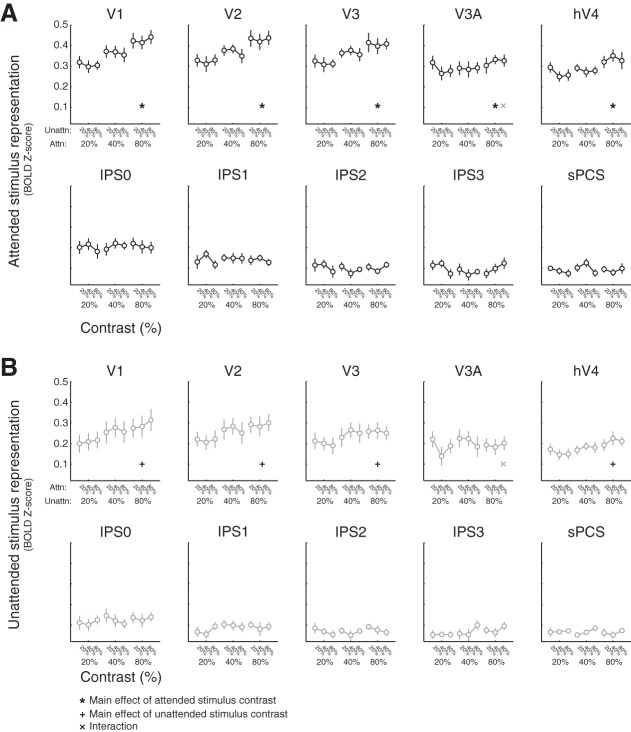
Fig. 6.
Attended stimulus representation does not depend on distractor stimulus contrast. A: reconstructed map activation for attended stimulus location across all salience combinations. Within each plot, linked points correspond to the contrast of the attended stimulus, and the individual linked points indicate the attended stimulus activation at each unattended stimulus contrast level (20%, 40%, 80%). Error bars are SE across participants. We observed no significant interactions [2-way permuted repeated-measures ANOVA within each region of interest (ROI), factors of attended and unattended stimulus contrast, P ≥ 0.041, minimum P value V3A), so we collapse across unattended stimulus salience within each attended stimulus salience level (Fig. 5). B: same as A, but for unattended stimulus activation, as sorted by attended stimulus contrast within each unattended stimulus contrast level. Again, we did not observe any significant interactions (P ≥ 0.026, minimum P value V3A), so these are collapsed (Fig. 5). Error bars are SE. All P values are available in Table 2. Black symbols indicate significant main effects or interactions, corrected for multiple comparisons via false discovery rate across regions of interest. Gray symbols indicate trends, defined as P ≤ 0.05, uncorrected. BOLD, blood oxygen level dependent; Attn, attended; Unattn, unattended.

