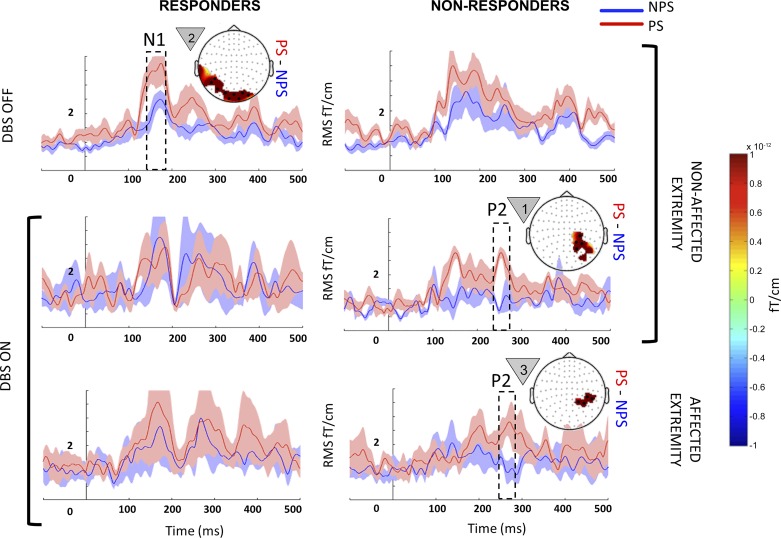
Fig. 5.
Within-state comparison in responders and nonresponders: event-related fields (ERF) from responders (left) and nonresponders (right) when they were anticipating painful (PS; red) and nonpainful stimuli (NPS; blue) on their nonaffected (top 2 rows) and affected extremities (bottom row) during the deep brain stimulation (DBS) OFF (top row) and ON states (bottom 2 rows). Each panel with a topography map shows the mean evoked responses from sensor clusters that showed significant responses (black dots), with shading around the line plot showing the SE. Each topographical map displays the average difference (PS − NPS) for the temporal window highlighted within the dotted box superimposed on the ERF. The countdown cue that evoked the significant effect is shown to the left of each topographic map. For comparison, in each row, the plot without a topography shows signal from sensors that showed significance in the opposite column. In the OFF state, PS vs. NPS did not show significant differences for the affected extremity in either responders or nonresponders, and hence the data are not shown. To better visualize slow changes during significant effect, the line plots were smoothed using a 10-ms moving average filter.

