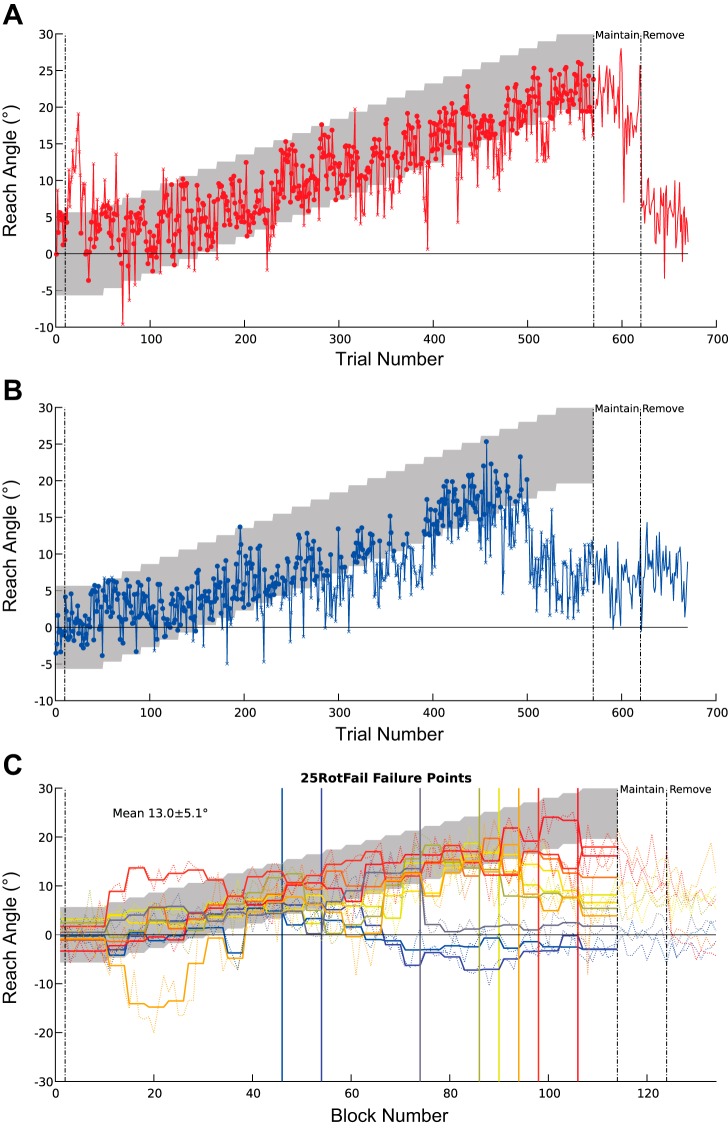
Fig. 3.
Experiment 1: trial-by-trial behavior. A and B: example of trial-by-trial reach angles from a subject who was successful at the final angle (A) and one who was unsuccessful (B). In each case rewarded trials are indicated by circles and nonrewarded trials by ×. Gray shaded region indicates the reward region. C: failure points for subjects in the 25RotFail group; thick lines are the mean reach angle for each subject at each rotation angle, thin lines represent mean of each block (average of 5 trials), and colors go from hot to cold matching failure angles ranging from high to low. Vertical lines represent the last angle at which mean reach fell within rewarded region for each subject. Mean and SD of all angles of failure are shown.

