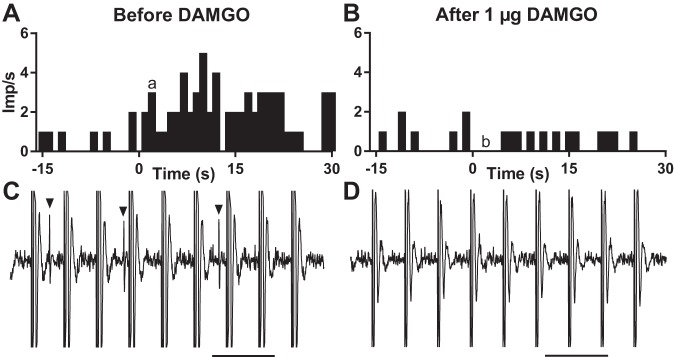
Fig. 1.
Individual example of the responses to static contraction of a group IV afferent before and after DAMGO. A and B: histograms showing the responses to contraction of a group IV afferent before (A) and after (B) injecting 1 µg DAMGO into the superficial epigastric artery. Contraction, which lasted for 30 s, was initiated at time zero. C and D: recordings of the impulse activity of the group IV afferent 3 s after the initiation of contraction. Arrowheads signify action potentials. Stimulation artifacts are the large equally spaced vertical lines. Scale bars = 100 ms. Lower case a and b correspond to time points shown in C and D, respectively. Imp, impulses.

