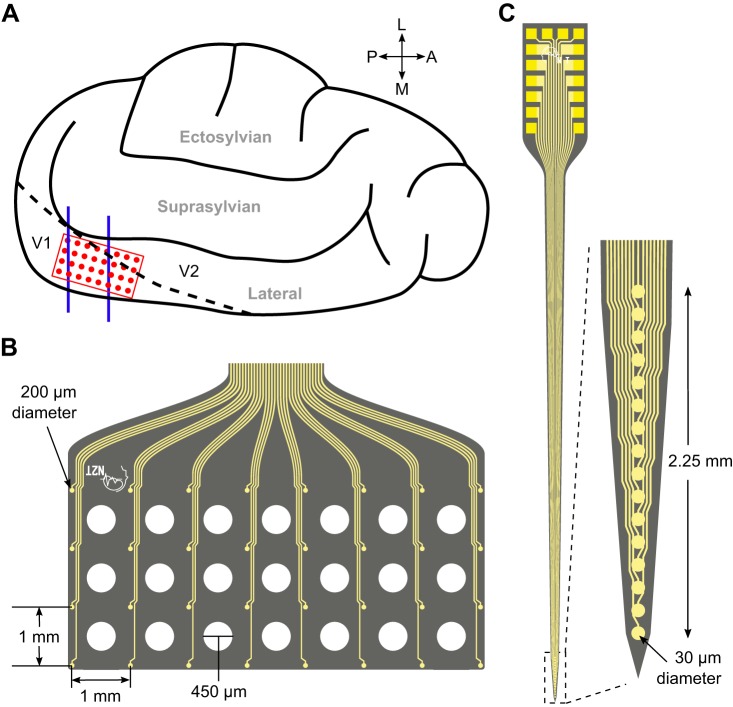
Fig. 1.
Recording electrode dimensions and placement on the cat visual cortex. A: illustrated left hemisphere of the cat brain with electrocorticography (EcoG) array (red) and depth probe (blue) placement over the primary visual cortex. B: dimensions of the ECoG array, showing holes in the substrate through which depth probes were inserted. C: dimensions of the depth probe. Electrode illustrations courtesy of NeuroNexus Technologies (NeuroNexus Technologies 2013).

