Fig. 2.
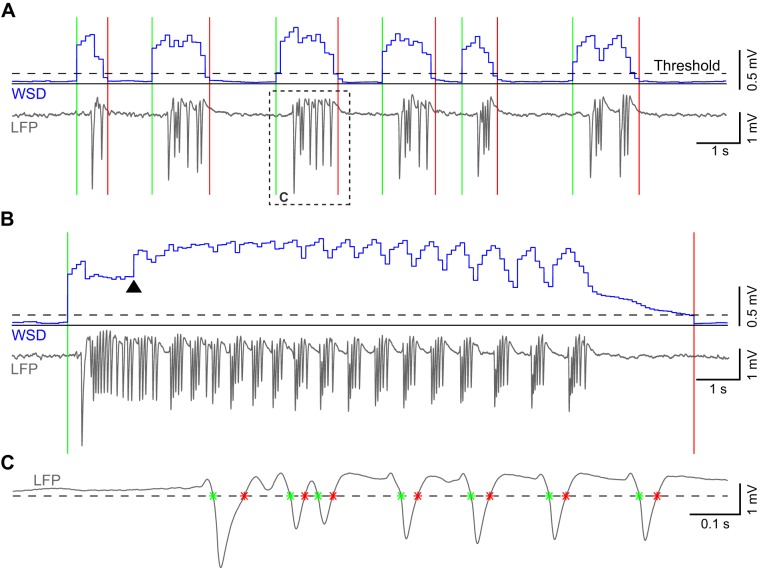
Epileptiform event and spike detection. A: trace of consecutive groups of spikes recorded on a single electrocorticography (EcoG) channel and the calculated standard deviation in overlapping windows (WSD; blue). Threshold (dashed line) crossings mark the beginning (green line) and end (red line) of individual events. The dotted box outlines an event trace enlarged in C. B: recorded local field potential (LFP) and the corresponding WSD of a longer event. Arrowhead marks the point at which the long-event correction factor in the detector takes effect. C: trace of a single event outlined in A and the voltage threshold (dashed line) used to detect the beginning and end of individual spikes (*).

