Fig. 5.
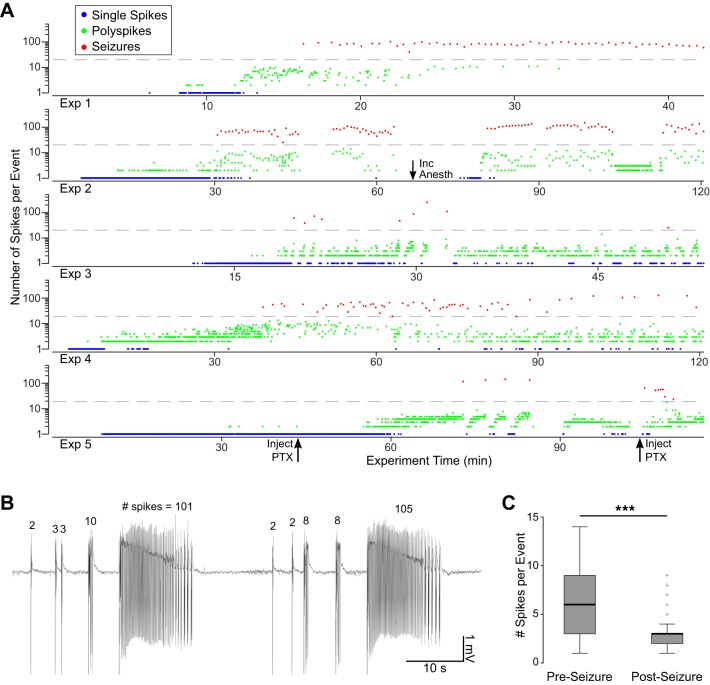
Temporal pattern of ictogenesis. A: progression of epileptiform events for each experiment. Single spikes (blue) appeared after initial picrotoxin application (t = 0), followed by polyspikes (green) and eventually seizures (red). Dashed gray lines mark the 20 spikes/event cutoff delineating polyspikes and seizures. Additional picrotoxin application (Inject PTX) and anesthesia increases (Inc Anesth) are noted with arrows. B: example trace from the second experiment shows polyspikes with an increasing number of spikes leading to seizures. C: the number of spikes in polyspikes immediately preceding (Pre) and following (Post) seizures. ***P < 0.001 indicates significance with the Wilcoxon rank sum test.

