Fig. 6.
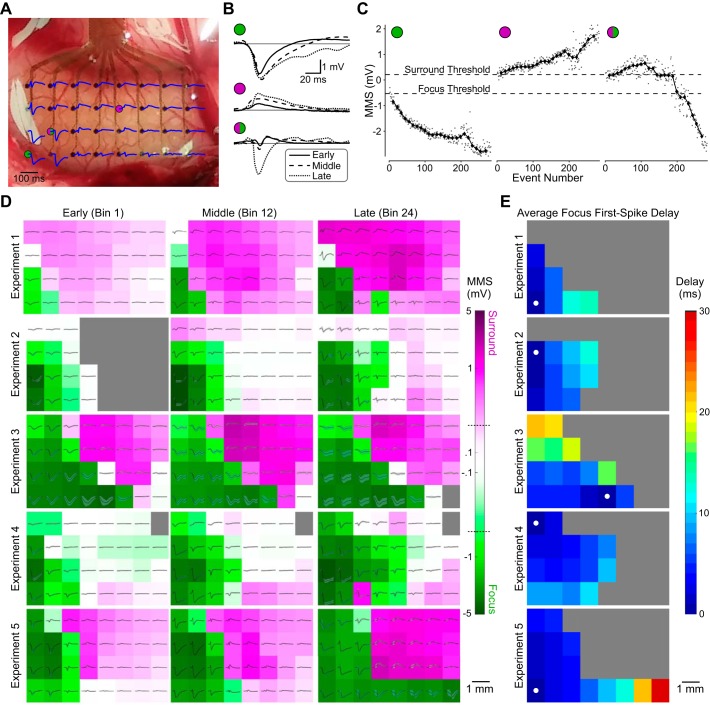
Spatiotemporal characteristics of epileptiform activity. A: activity during the first spike of one seizure in the first experiment as recorded across the electrocorticography (EcoG) array. Picrotoxin was applied near the bottom left of the array, where large negative spikes were seen. B: example first spikes from 3 electrodes at different points in the recording (early, middle, and late). Two electrodes were in either the focus (green circle) or surround (purple circle) throughout the recording; the third began in the surround but was eventually recruited into the focus (green/purple circle). C: the first-spike min-max sum (MMS) on the same electrodes for every event (gray dots) and the median MMS in each bin (black diamonds), with classification thresholds (dotted lines). Left and middle plots show data from electrodes that remained in the focus (green circle) and surround (purple circle) in this experiment, respectively, whereas the electrode in right plot began in the surround but was eventually recruited into the focus. D: ECoG array in 3 bins during early, middle, and late portions of each experiment (n = 5), with mean first-spike traces (black) and SD (gray) in the corresponding bin for each electrode. Background color, on a log scale, denotes the median bin MMS for each electrode, with green representing negative MMS (focus) and purple positive MMS (surround). Dotted lines on the color bar mark the MMS thresholds for focus and surround classification. E: delay maps showing the spread of the first spike of events in the focus on the ECoG array averaged across each experiment. Filled white circles mark the earliest-onset electrode.

