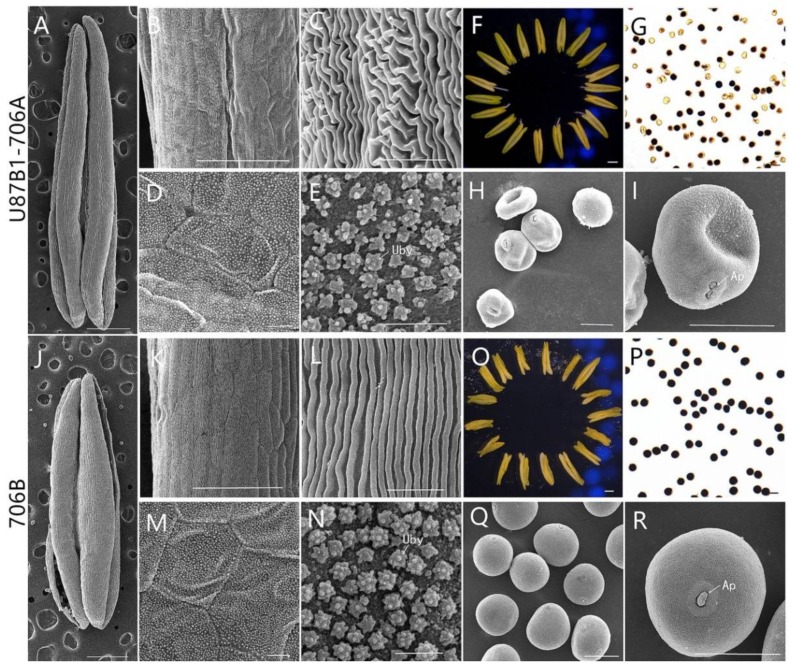
Figure 2.
Comparison of scanning electron micrograph observations, I2-KI staining, and anther morphology in U87B1-706A (A–I) and 706B (J–R) at the trinucleate (Tn) stage. (A,F,J,O): anthers; (B,C,K,L): outer epidermal cells; (D,E,M,N): inner epidermal cells; (G,P): microspores by I2-KI staining; (H,I,Q,R): microspores; Uby, Ubisch bodies; Ap, germination aperture. Scale bars are 1 mm in (A,F,J,Q); 100 μm in (B,K); 50 μm in (G–I,P–R); 10 μm in (C–E,L–N).

