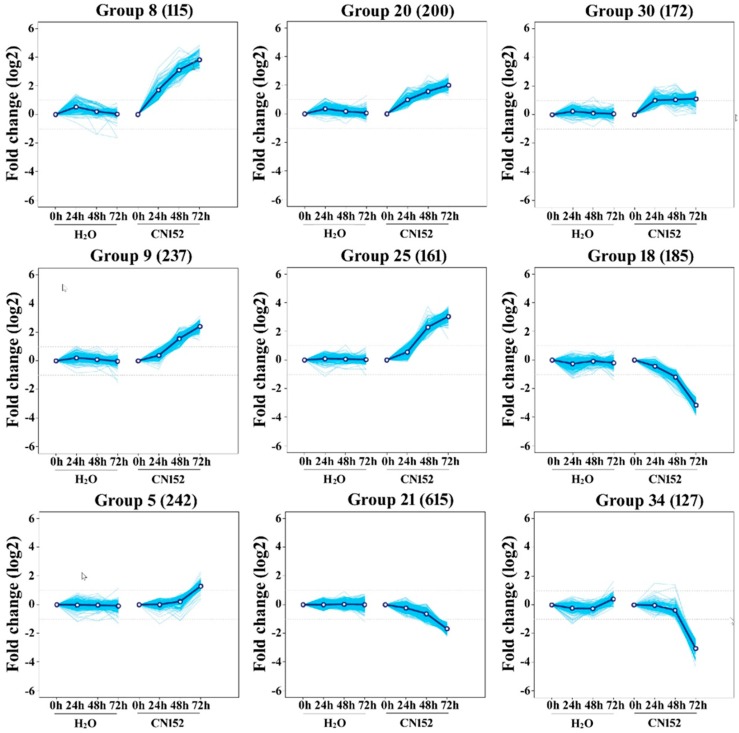
Figure 3.
K-means clustering of the differential expression transcription units altered by Phytophthora infestans infection. Group 5, 8, 9, 20, 18, 21, 25, 30, and 34 are the nine representative clusters with different gene profiles; Numbers in the brackets are the number of genes for each group. X-axis, different time points of 0, 24, 48, and 72 h after CN152 inoculation and H2O treatment. Y-axis, log2 fold change of genes expression levels in 24, 48, and 72 hpi compared to 0 h; the dotted line means a value of 1.0, which indicates 2-fold greater expression in the cluster of interest.

