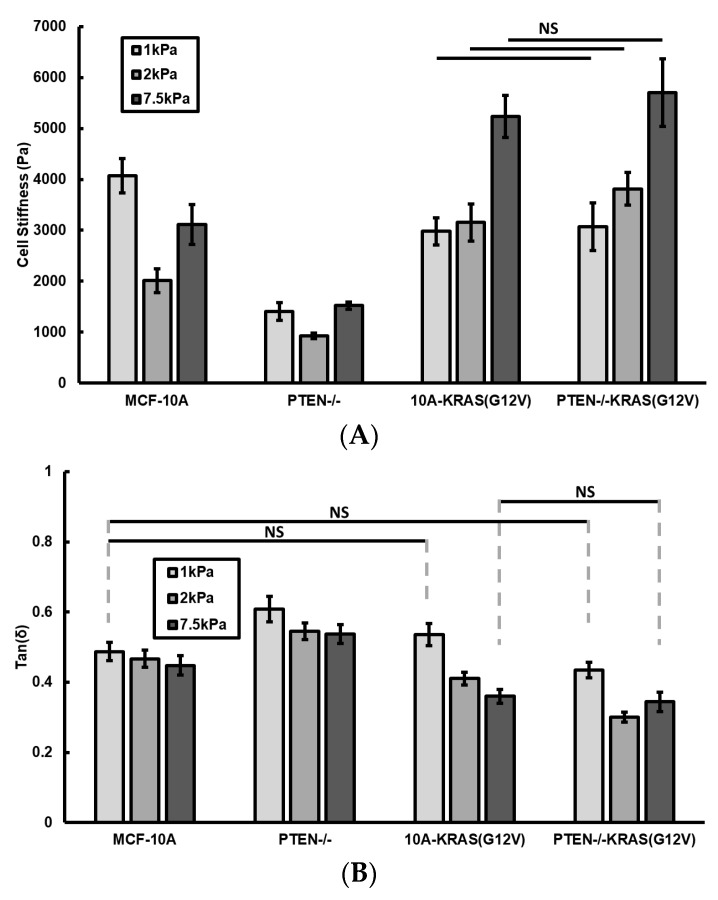
Figure 4.
(A) Cell stiffness and (B) loss tangent (tan(δ)) values for control MCF-10A, PTEN−/−, 10A-KRAS(G12V), and PTEN−/−KRAS(G12V) cell conditions seeded on 1, 2, and 7.5 kPa collagen-coated polyacrylamide gels. Number of cells measured: n = 17–54. NS signifies non-significant differences between two groups (p > 0.05).

