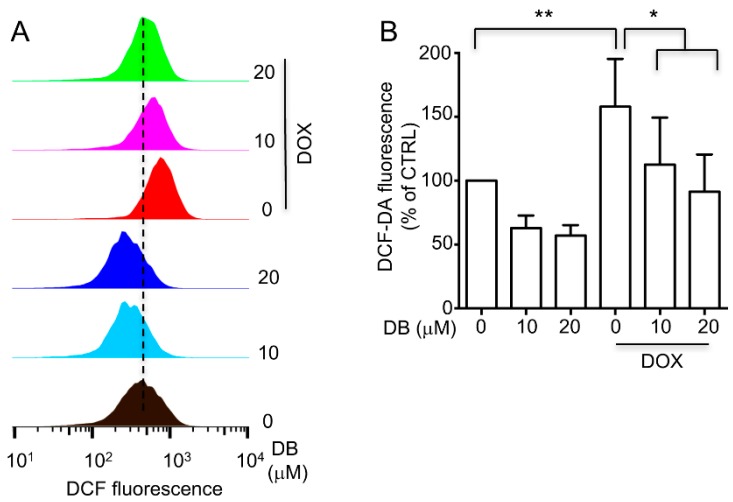
Figure 5.
(A) The inhibitory effects of DB on intracellular ROS generation induced by DOX. H9c2 cells were pre-treated without or with DB for 2 h, followed by incubation with 1 μM DOX for another 24 h. ROS generation was assayed by DCFH2-DA oxidation-based fluorescence using a flow cytometry. (B) ROS levels are expressed in terms of relative intensity of cell fluorescence. * p < 0.05, ** p < 0.01, compared with DOX alone treated group.

