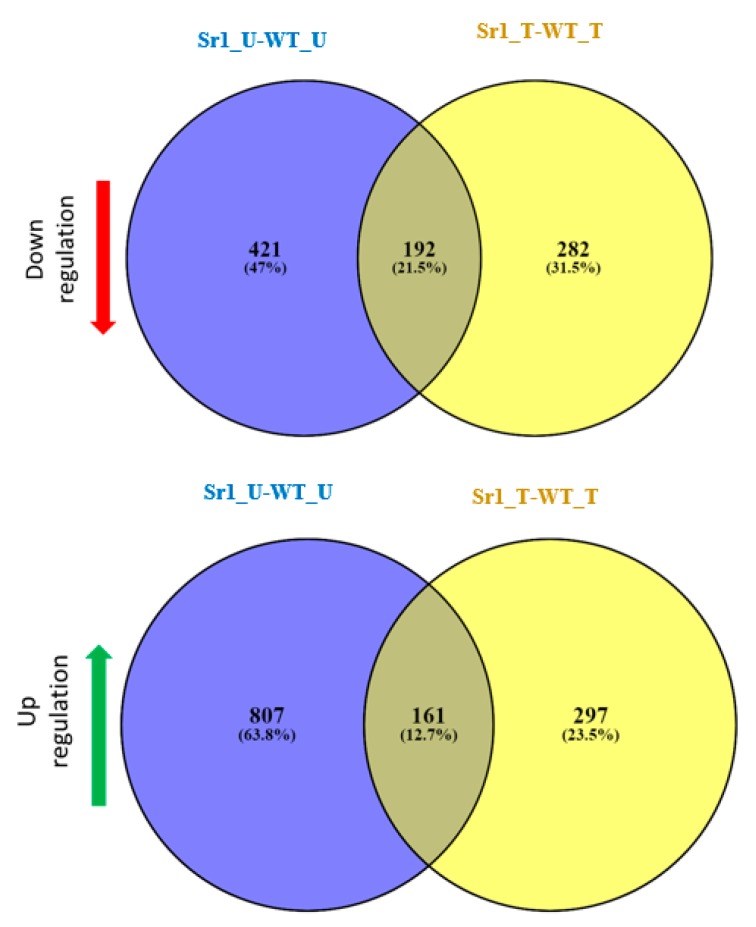
Figure 2.
Comparative analyses of transcriptomes in WT and atsr1. Venn diagram of a double-sided comparison of microarray expression data revealing the circles which represent total number and arrows which represent the number of differentially expressed genes (DEGs) between the genotype test or pathogen inoculation. 192 genes were observed that are down-regulated with a fold change (FC) ≤ −2 and p-value < 0.05 in both of the tests, and 161 genes were observed to be up-regulated with an FC ≥ 2 and p-value < 0.05 in both of the tests. WT_U: WT untreated; WT_T: WT treated with pathogen infection for 24 h after infiltration with Pst DC3000; Sr1_U: sr1 untreated; Sr1_T: Sr1 treated with pathogen infection for 24 h after infiltration with Pst DC3000.

