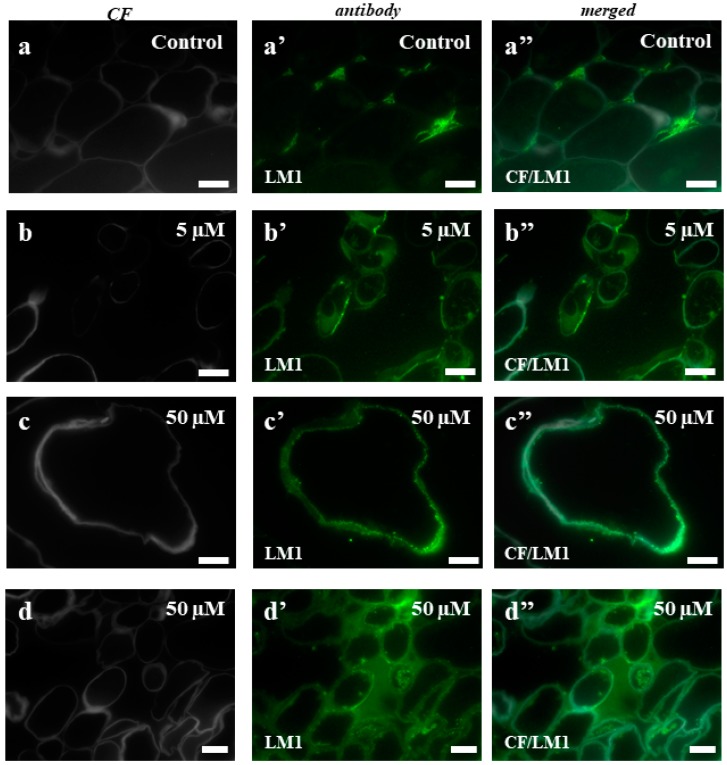
Figure 7.
Immunolocalization of LM1 in the Brachypodium callus. (a–a”): control callus. (b–b”): callus that has been treated with 5 µM of 5-azaC. (c–c”,d–d”): callus that has been treated with 50 µM of 5-azaC. The greenish background on these photomicrographs is due to the autofluorescence. Scale bars, 10 µm.

