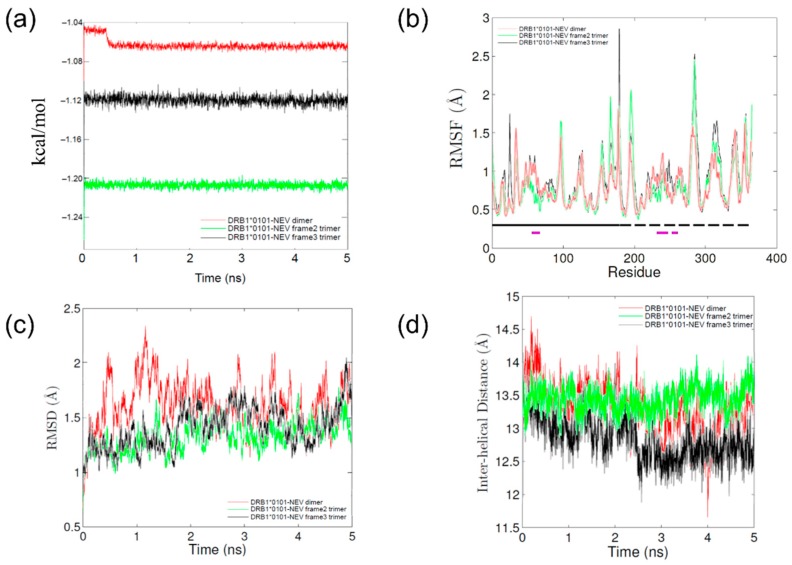
Figure 3.
Parameter profiles of molecular dynamics (MD) simulations of nevirapine-bound HLA-DRB1*01:01. (a) Calculated energies vs. time plot; (b) RMSF values of polypeptide backbone. The location of α and β chains and residues that comprise the peptide binding groove helices are indicated by the solid and dashed lines running just above the x-axis, respectively. The α chain (solid black), α chain helix (solid purple), β chain (dashed black), and β chain helix (dashed purple); (c) Root mean square deviation (RMSD) values of polypeptide backbone vs. time plot; and (d) The average distance between each Cα in the helix of the α chain and the closest Cα atom in the helix of the β chain.

