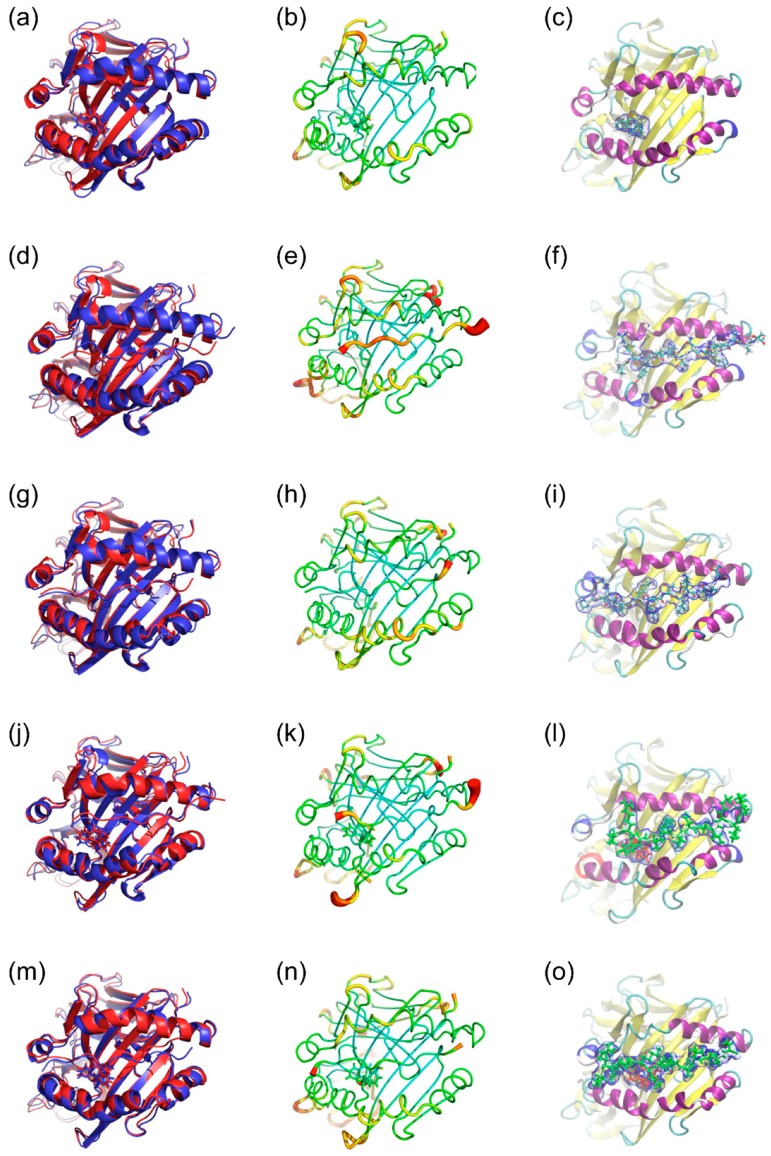
Figure 4.
Simulated representative structures of nevirapine-bound HLA-DRB1*01:01 (a–c), hemagglutinin (HA) peptide-bound HLA-DRB1*01:01 in frame 2 (d–f) and frame 3 (g–i), and nevirapine-bound HLA-DRB1*01:01-HA peptide in frame 2 (j–l) and frame 3 (m–o). (a,d,g,j,m): Alignment of initial structure (red) and representative structure (blue); (b,e,h,k,n): Sausage plot of the structure, where the color and thickness of HLA-DRB1*01:01 are proportional to the RMSF of Cα; and (c,f,i,l,o): The volume occupied by nevirapine and HA peptide. The blue envelope outlines the 50% occupancy volume of nevirapine (red) and HA peptide (green).

