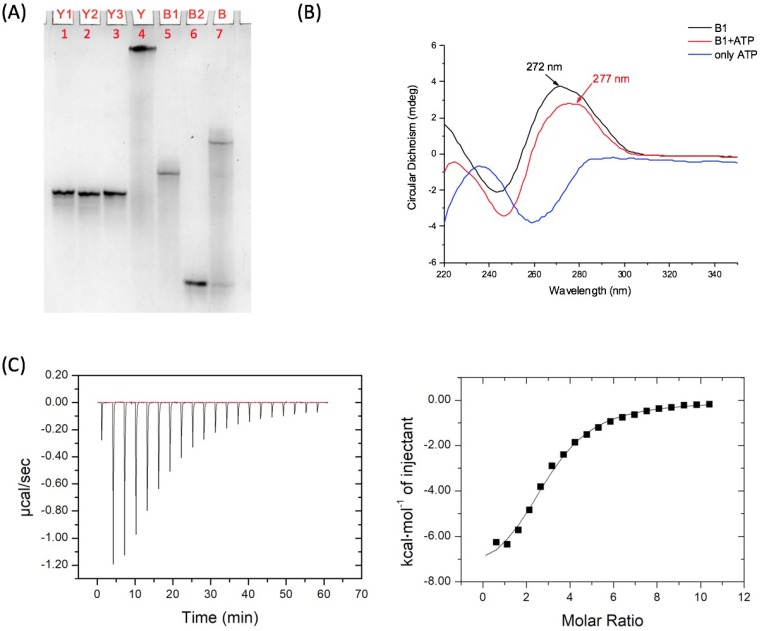
Figure 1.
Characterization of the DNA assemblies and ATP aptamer structure. (A) Characterization of Y-scaffold and B-linker by 20% native PAGE. Three ssDNAs Y1 (Lane 1), Y2 (Lane 2), and Y3 (Lane 3) hybridized to form the Y-scaffold (Lane 4), and two ssDNAs B1 (Lane 5) and B2 (Lane 6) assembled into the linear B-linker (Lane 7); (B) CD spectra to characterize the conformation of the aptamer sequence in DNA strand B1 with or without ATP; and (C) Isothermal titration calorimetry (ITC) data (left) and fitting curve (right) of binding strength between B1 and ATP.

