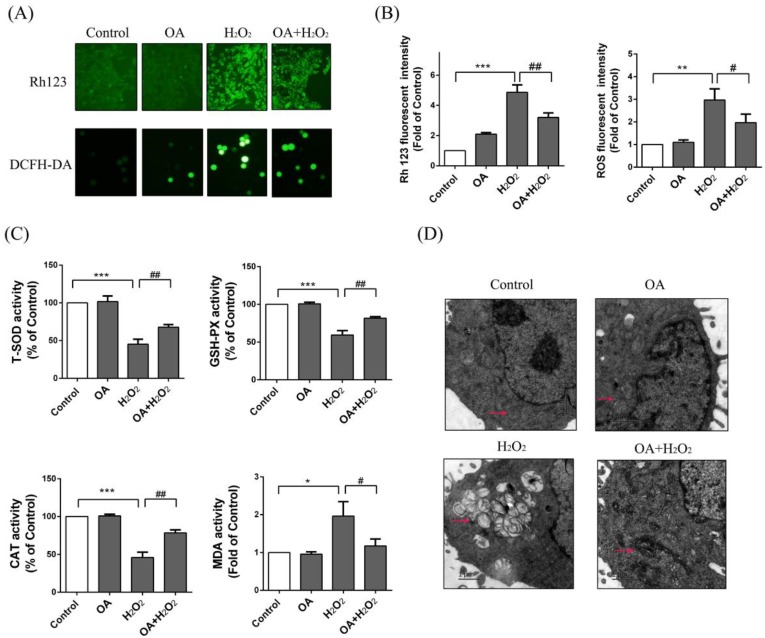
Figure 3.
Effects of OA on reactive oxygen species (ROS) and morphology of mitochondria. (A) The membrane potential changes and ROS production were detected by Rh123 and DCFH-DA probes respectively by fluorescence microscope (200×). Groups were as described in “Methods: Cell line and Reagents”; (B) The fluorescence intensity of Rh123 and ROS was measured by FCM; (C) The activity of SOD, GSH-PX, CAT, MDA. Groups were as described in “Methods: Cell line and Reagents”; (D) The morphology of mitochondria by transmission electron microscopy. Groups were as described in “Methods: Cell line and Reagents”. Pink arrows point to mitochondria. The experiments were repeated at least three times. The results were presented as the mean ± SD. * p < 0.05, ** p < 0.01, *** p < 0.001 compared with the control group and # p < 0.05 and ## p < 0.01 compared with the H2O2 group.

