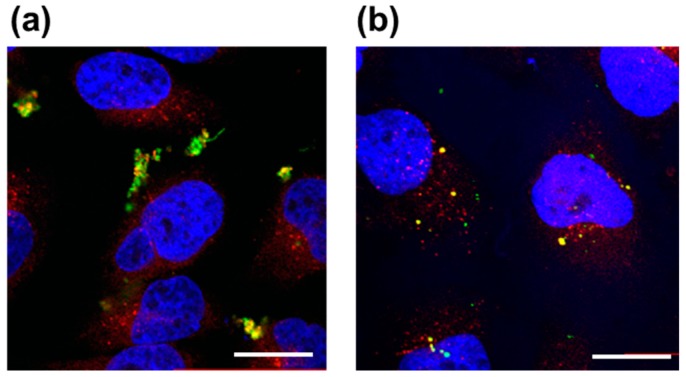
Figure 5.
Confocal laser scanning microscopy images of HeLa cells after 4 h treatment with (a) P(NIPAAm-co-DMAAm20%)-FL and (b) Tyr-P(NIPAAm-co-DMAAm20%)-FL at 40 °C. Fluorescent probes appear green, lysosomes are stained red (LysoTracker Red DND-99), and the nuclei are stained blue (DAPI). Magnification is 40×; the scale bar represents 20 μm.

