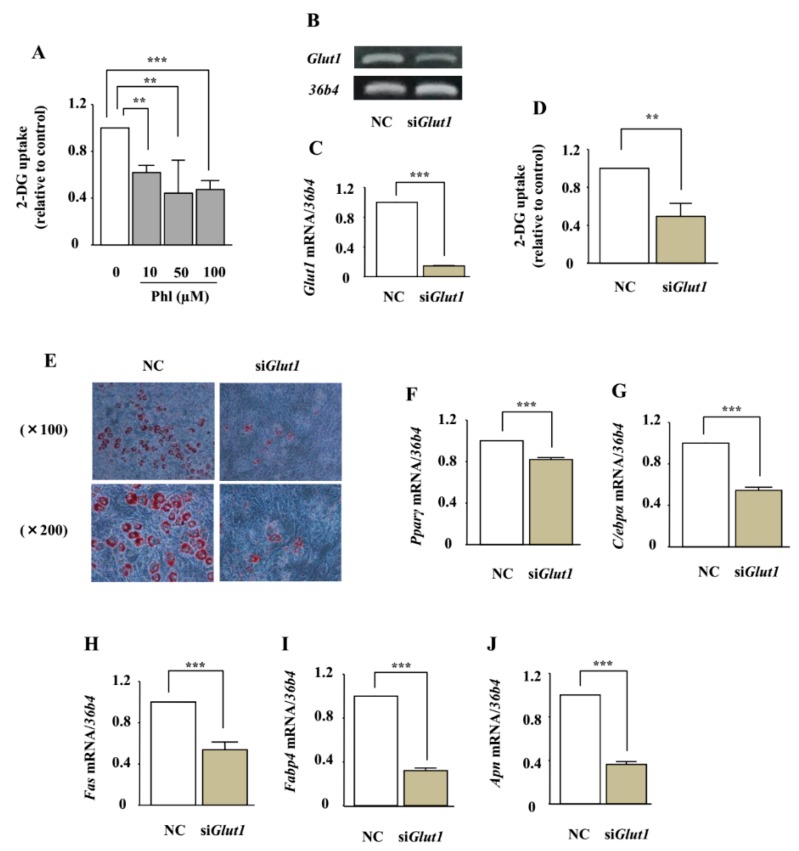
Figure 7.
The role of glucose uptake inhibition in adipocyte differentiation in ST2 cells. (A) After pre-incubation in Krebs–Ringer Phosphate-Hepes (KRPH) buffer containing 0–100 µM phloretin, the cells were treated with 2-DG containing phloretin 0–100 µM, and then the colorimetric uptake assay was performed. The results are expressed as mean ± SE (n ≥ 3); ** p < 0.01, *** p < 0.001. (B,C) After transfection with Glut1 and non-specific control siRNA, the mRNA expression of Glut1 was examined by RT-PCR (B) and real-time PCR (C). The housekeeping gene 36b4 was used to normalize the differences in the efficiencies of reverse transcription. The results are expressed as mean ± SE (n = 6); *** p < 0.001. NC: negative control. (D) After transfection with Glut1 or scramble control siRNA, the cells were incubated in KRPH buffer for 20 min, treated with 2-DG containing 0–100 µM phloretin, and then the colorimetric assay was performed. The results are expressed as mean ± SE (n = 6); ** p < 0.01. (E) After transfection with Glut1 and non-specific control siRNA, the cells were incubated in adipogenic medium for 8 days, and oil red O staining was performed. (F–J) After transfection with Glut1 and non-specific control siRNA, the cells were incubated in adipogenic differentiation medium for 4 days. The mRNA expression of adipogenic differentiation markers (Pparγ, C/ebpα, Fas, Fabp4, and Apn) was examined by real-time PCR. The results are expressed as mean ± SE (n ≥ 4); *** p < 0.001.

