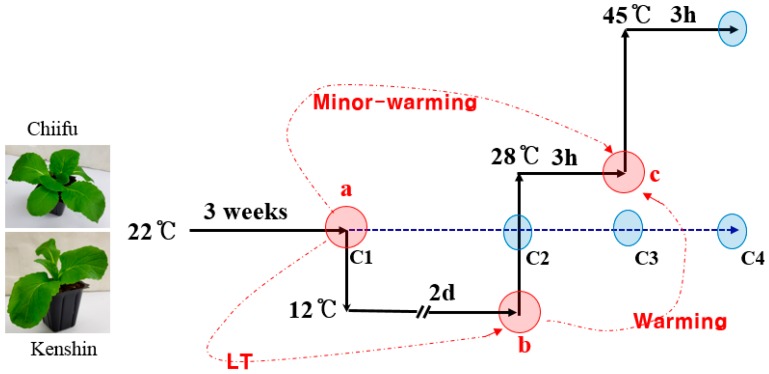
Figure 1.
Temperature treatment and sampling schedule. Collection times are indicated by circles. Red circles (a–c) represent sampling times for the microarray experiments as well as qRT-PCR analysis. Blue circles indicate that the collected samples were only used for qRT-PCR. Shoots from five individual plants were sampled and frozen in liquid nitrogen. Treatments were as follows: (a) (22 °C) to (b) (12 °C); low-temperature (LT) conditions; (a) (22 °C) to (c) (28 °C), minor-warming conditions; and (b) (12 °C) to (c) (28 °C), warming conditions.

