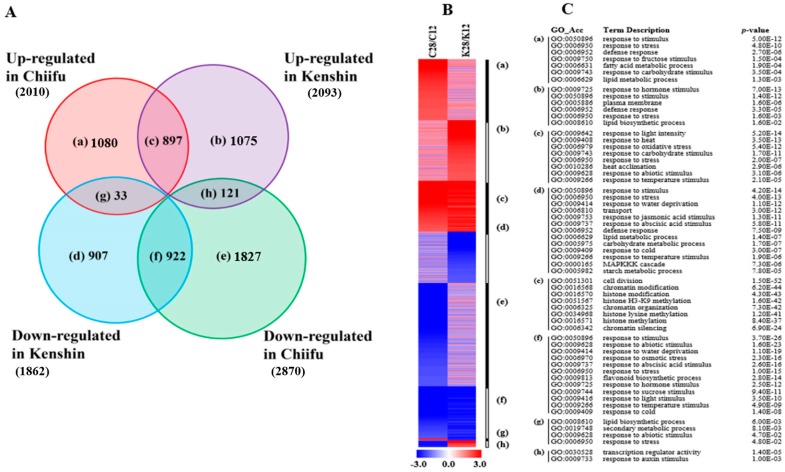
Figure 2.
Analysis of warming-responsive genes from two contrasting inbred lines, Chiifu and Kenshin. (A) Venn diagram of DEGs with over 2-fold differences in expression; a–h indicate the groups of genes in each category; (B) Heatmap of DEGs in each group based on fold change; (C) Gene Ontology (GO) enrichment analysis of DEGs in each group, with p values obtained using the agriGO tool (http://bioinfo.cau.edu.cn/agriGO/index.php). C and K of Figure 2B indicate Chiifu and Kenshin, respectively.

