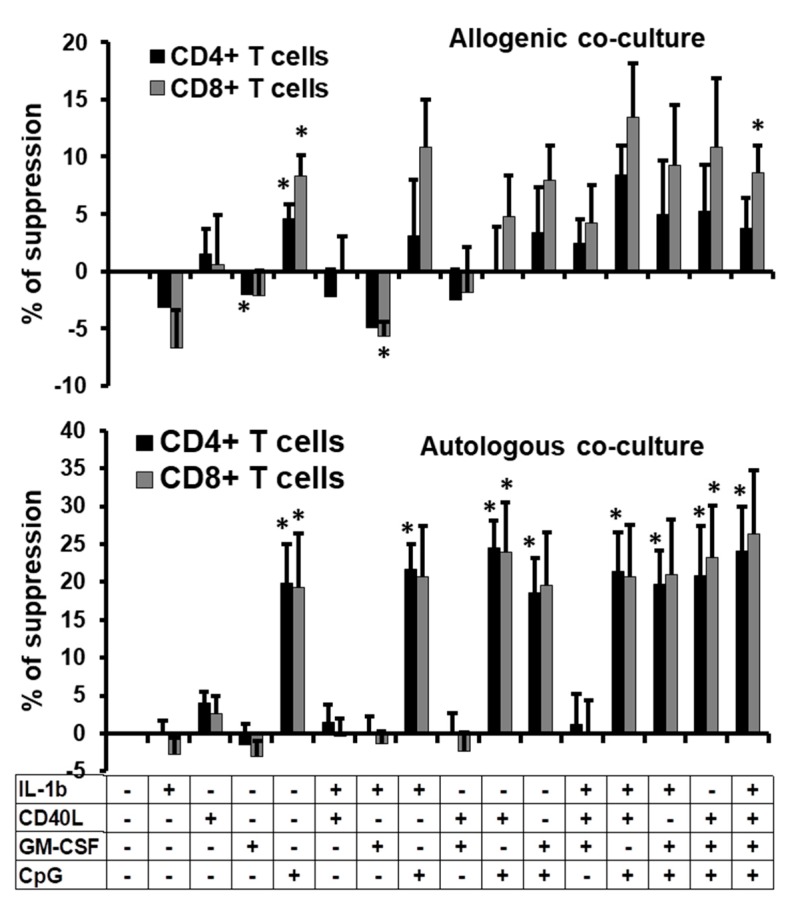
Figure 4.
Anti-proliferative function of the stimulated B cells. Percentages of suppression of proliferation of allogenic (upper panel) or autologous PBMCs (lower panel) treated with CFSE and co-cultured with non-treated or treated-B cells (ratio B cells:PBMCs of 2:1) at day 3 post-co-culture. B cells were non-treated or treated with IL-1β, CD40L, GM-CSF, or CpG alone, or in combination for 2 days before co-culture with CFSE+-PBMCs. Average + SEM of the percentages of suppression of CD4+ and CD8+ T cell proliferation from four different experiments are represented. * p < 0.05 when comparing non-treated condition versus treated condition.

