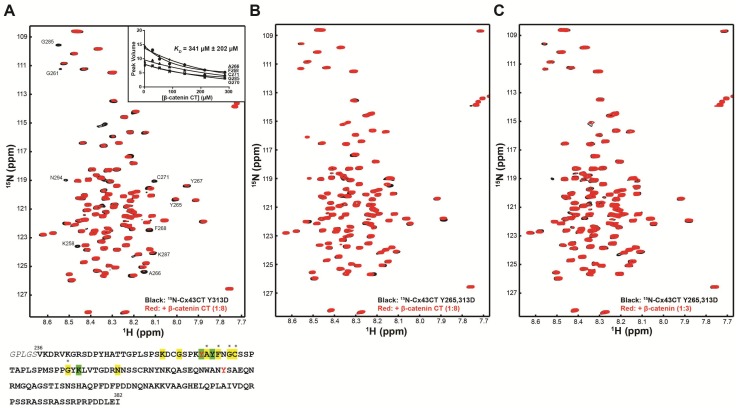
Figure 4.
Mimicking phosphorylation of Cx43CT residues Y265 and Y313 inhibits the interaction with the β-catenin CT domain. 15N-HSQC spectra of (A) Cx43CT Y313D alone (black) and in the presence of the β-catenin CT domain (red) or Y265,313D alone (black), and in the presence of the (B) β-catenin CT domain and (C) full-length β-catenin (red). The molar ratio for each experiment is indicated in the figure. In panel A, provided is a subset of residues used to calculate the KD of the interaction by fitting their decrease in signal intensity according to β-catenin CT concentration. Also represented below the 15N-HSQC spectra is the Cx43CT amino acid sequence. Highlighted are the affected residues (yellow—peaks broadened beyond detection; green—peaks decreased in intensity). Asterisks denote amino acids used to calculate the binding affinity for the β-catenin CT interaction with the Cx43CT. Tyrosine residues 265 and 313 phosphorylated by Src are indicated in red.

