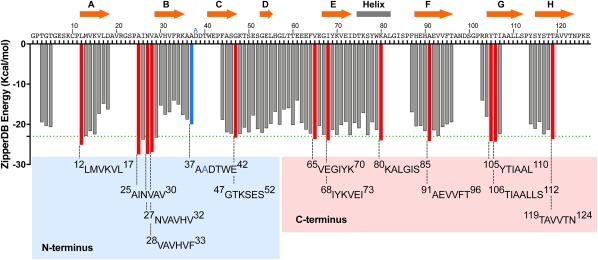
Figure 1.

Propensities of steric zipper formation of each 6‐residue segment within the TTR sequence. Amyloidogenic propensities were calculated using the 3D profiling method ZipperDB.15 Segments having energies of −23 kcal mol − 1 (green dashed line) or lower are predicted to form fibrils.16 Segments that we selected for crystallization are represented with red bars. The segment containing the familial mutation ATTR‐D38A is represented with a blue bar. The ZipperDB Rosetta energy prediction of the wild‐type sequence 37ADDTWE42 is −18.0 kcal mol−1 compared to −20.0 kcal mol−1 of the mutant sequence 37AADTWE42. The schematic of the secondary structure of native TTR is shown on top of the sequence. The blue and pink boxes highlight the TTR segment sequences of the N‐terminal and C‐terminal regions, respectively, that we described in this study. Only two segments of the N‐terminus, 28VAVHVF33 and 37AADTWE42, resulted in the formation of diffracting crystals. From the C‐terminus, only the segment 65VEGIYK70 did not result in a crystal structure.
