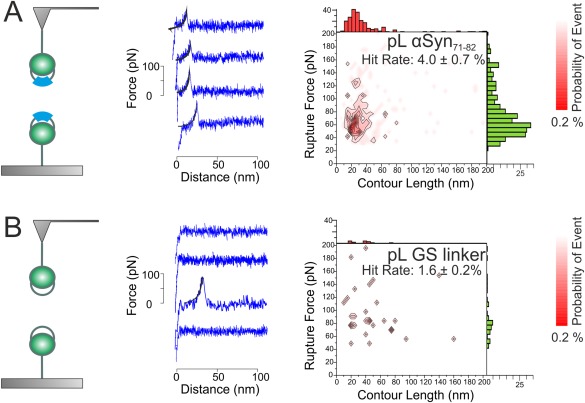
Figure 3.

SMFS can detect dissociation events for pL αSyn71–82 but not pL GS. Schematic (left), sample force extension profiles (middle), and a F R versus L c scattergram (right, rendered as a contour plot and showing the associated L c and F R frequency‐histograms above and to the side, respectively for (A) pL αSyn71–82 and (B) pL GS dissociation events). A WLC (black line) is fitted to each force‐extension profile. The contour plot for pL αSyn71–82 shows a “hotspot” of reproducible and correlated L C and F R values. No “hotspot” is visible for pL GS dissociation events. The total number of force‐retract cycles (total triplicate) are 8000 and 2500 for pL αSyn71–82 and pL GS dimerization interactions, respectively.
