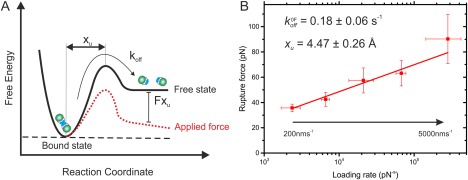
Figure 4.

Using dynamic force spectroscopy to investigate αSyn71–82 dissociation. (A) Schematic representation of an unbinding energy landscape. The dotted line depicts the tilted energy landscape under force. x U is depicted as the distance from the bound energy well to the transition state. is shown as the stochastic process of crossing the transition energy barrier. (B) Dynamic force spectrum of αSyn71–82 dissociation. Data (mean of the triplicate datasets, error bars are the standard deviation) are fitted to the Bell‐Evans model45, 46 to obtain values and x U (shown inset). The errors for and x U were calculated by manual bootstrapping. The total number of approach retract cycles (total triplicate) for pL αSyn71–82 dimer dissociation events are 5200, 5500, 6500, 6000, and 5500 for pulling speeds 200, 500, 1000, 3000, and 5000 nms−1, respectively.
