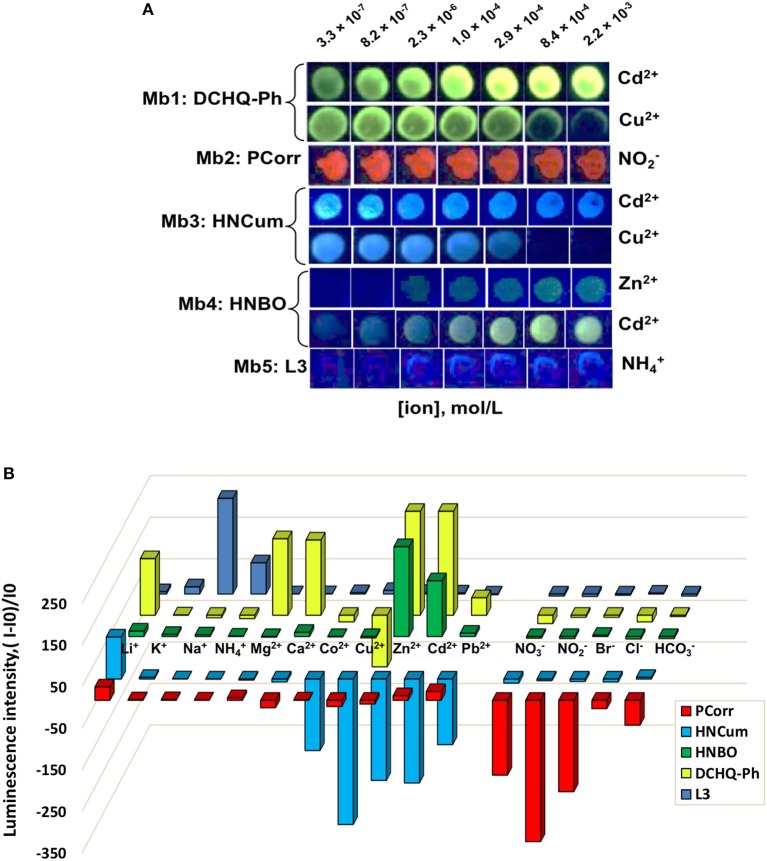
Figure 3.
Fluorescence responses of membranes Mb1–Mb5 toward several analytes in their individual solutions evaluated with PT at λex = 380 nm LED illumination in 0.01 mol/L HEPES buffer at pH 7.5. (A) Photograms of sensors PT responses with the highest registered luminescence changes; (B) pattern of the relative intensity changes of membranes Mb1–Mb5 toward all tested analytes at a concentration of 2.9 × 10⁻⁴ mol/L.

