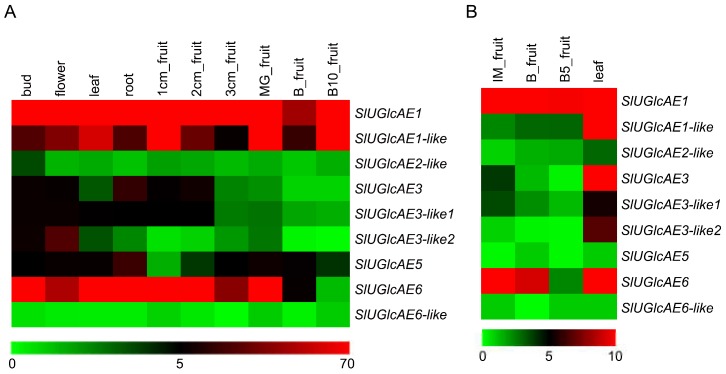
Figure 5.
Heatmap analysis of UGlcAE family gene expression in various organs of tomato. (A) tomato cultivar Solanum lycopersicum (mature green stage (MG), breaker stage (B), ten days after breaker stage (B10)); (B) wild relative Solanum pimpinellifolium (immature green stage (IMG), breaker stage (B), five days after breaker stage (B5)). The expression data was gained from pubic RNA-seq data and shown as log2 as calculated by FPKM values (fragments per kilo base of exon model per million) mapped reads. The green boxes represent the lower expression level, whereas the red boxes represent the higher expression level.

