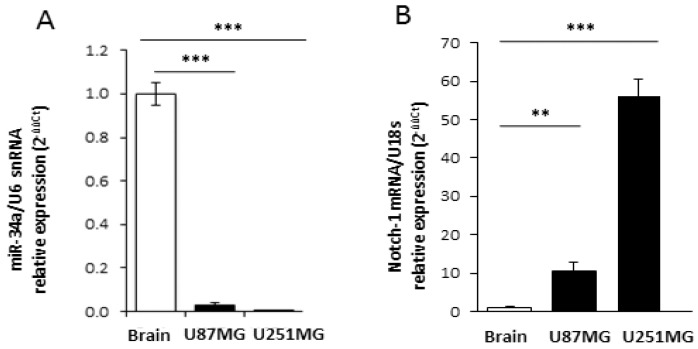
Figure 2.
Expression of Notch-1 and miR-34a-5p in GBM cell lines and human brain. Real time RT-PCR analysis of miR-34a-5p (A) and Notch-1 (B) relative expression in U87MG or U251MG cell lines (black bars) compared to human normal brain (white bar). snRNA U6 and 18S were respectively used as the internal standard (** p < 0.01; ***p < 0.001; t-test).

