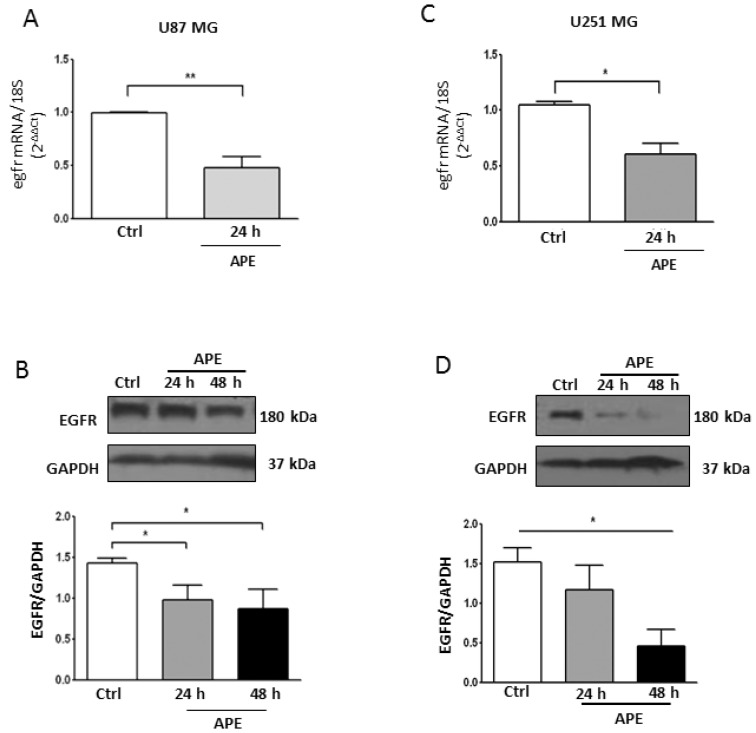
Figure 6.
EGFR Expression in GBM cell lines. Real time RT-PCR and Western blot analysis (A,B, respectively) of EGFR in U87MG. Parallel analyses were performed in U251MG cells (C,D, respectively). Both lines were untreated or treated with 100 μM APE for 24 and 48 h. Representative blots are shown from three independent experiments. GAPDH was used as the internal reference protein. (* p < 0.05; ** p < 0.01; t-test and one-way ANOVA test).

